|
Croker-Rhyne Co., Inc. |
|
Main Page |
Philosophy | Current
Recommendations |
Newsletter Archives Contact Us
|
|
|
August 24, 2005
As it has been over two months since my last newsletter, I'll start with a
quick review of some previously held opinions:
Corn and Soybeans - Turned into an incredibly volatile affair, with both
markets now being back below where they were when I first recommended them
on June 3rd. I am standing aside in both of those markets.


In mid-March I began to recommend buying the U.S. Dollar Index looking for a
move up at least up to the 91-92 area. With the Dollar recently trading
within a few ticks of 91, I am now taking a fresh look at the
currencies and am on the sidelines in the Dollar Index.

Sell Copper
I have been recommending a short position in copper since April 12th, with
my most recent recommendation coming in our June 14th newsletter....and
I have been dead wrong. Even so, I still believe this is a potentially big
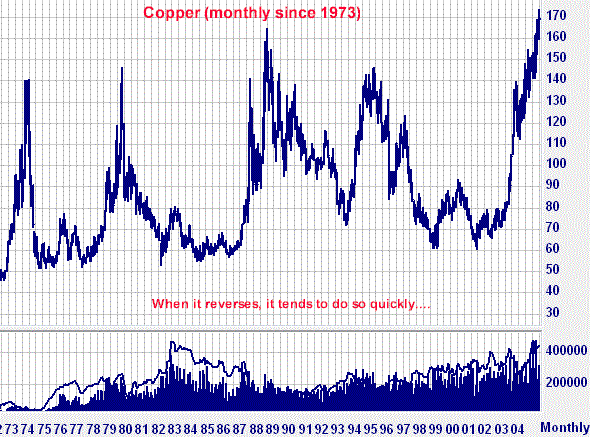
trade and intend to stay with the idea. As I have pointed out in previous
newsletters, when copper tops out, it tends to do so with fairly dramatic
drops, some examples of which I'll list here:
Major Tops in Copper Last 30 Years
EACH ONE CENT MOVE = $250 PER FUTURES CONTRACT...
If you want to see charts of those moves go to http://www.crokerrhyne.com/newsletters/04-12-05.htm .
As I've said before, picking tops can be a tough endeavor. Aside from the
fact tops can be quite volatile/nerveracking, they are also usually
accompanied by highly emotional market rhetoric that suggests you are
crazy to be selling instead of buying....Here are some quotes off my
newswires on the day copper made a new all time high last week:
"Copper futures roared to record levels ....in a buying frenzy driven
by bullish fundamentals and a chart that offers no natural resistance."
"It's extremely bullish....It's all just positive, positive,
positive."
"If you look at the charts, either you're long (a buyer), or you don't
trade."
"If you are going to trade this, you still have to buy it at $1.75.
People who need it have to buy it."
"There's no technical resistance on the chart anymore..."
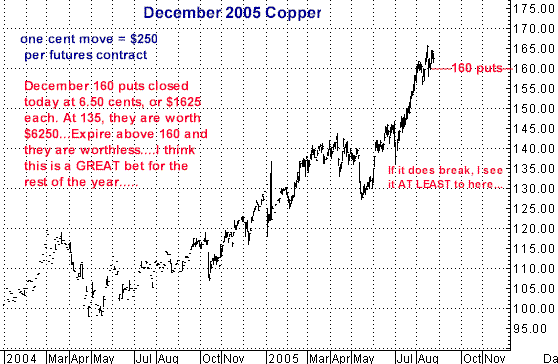
Back in June I said that if copper did get up to $1.70-$1.75, what I didn't
want to do was get scared and give up on the idea (which I almost
did)....that I would continue to be short through buying puts and selling
futures on the December contract.....I may still be wrong on this, but it is
just very difficult for me to imagine it being January 1, 2006 and for Copper
to STILL be at $1.70. SOMEWHERE, the plug gets pulled and all of a
sudden traders are looking at the market thinking, "Why in the hell
didn't I just buy some puts when it was up there in the thin air?". And
that is what I absolutely recommend.....Buy some December puts and see what
happens....If history is any guide, I believe there is a 40 or 50 or 60 cent
"evaporation" coming soon (or NOW) in this market and I
intend to be there....


Buy Treasury Bonds
There still seems to be this universally held opinion that long term
interest rates HAVE to go up, and with it, Treasury Bond prices have to go
down. I still firmly disagree with this idea...I think the Bond
market is going a LOT higher and long term interest rates are going a lot
lower....If you want a lengthy discussion of why I believe long
rates will continue to drop, see my newsletters from earlier this year at: http://www.crokerrhyne.com/newsletters/01-05-05.htm
and http://www.crokerrhyne.com/newsletters/01-13-05.htm
or visit the website at www.crokerrhyne.com
.
The bottom line for my bullish opinion, however, is summed up in this
excerpt from the Jan. 5th newsletter:
"Very briefly, I think the analytic community can talk up the idea of a
decline in Bond prices (and rise in long term yields) all they want, but the
simple fact is people who actually own Bonds are not really interested in
selling them. My mother, for example, owns Treasuries bought maybe
8-10 years ago paying about 7.5% a year that still have 15 years to go. If
she sells them, what does she do with the money to replace that
income?....As I have said for some time now, I believe the demographics of
the Baby Boom (approaching retirement) mean that more and more of retirement
accounts will be selecting fixed income investments (however "low"
might be the perception of yield), which means a steady influx of buyers
somewhat similar to what the Stock Market experienced in the 1990's. When
you actually buy a 20 year instrument, this is generally not a short term
trade, i.e., not something you are going to sell in one or two years....This
may be simplistic, but in the real world ( as opposed to the analytic
community), I think the equation of no actual sellers and a steady influx of
new buyers argues for Bond prices to go higher, and long rates lower, for
some time to come."
Those sentiments, however, are really just relevant to the long term
picture, and may or may not be important to you or me as a trader at this
specific moment in time....but here are the facts; During 9 of
the last 10 years, from now until year end, WHATEVER was going on in the
economic world, Treasury Bonds have had a decided tendency to go up.
I have long been aware of this and have an opinion as to why it is true
(call me if want to hear it) but, to me, why is not so important as the fact
of what "usually" happens in Treasuries over the next four months.
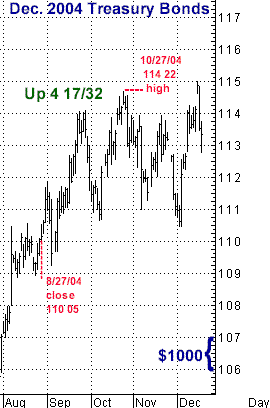
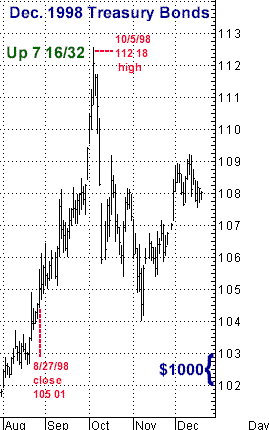
I've put this in both table and chart form and you can see for yourself.....
The table below notes where December Bonds were on August 27th, then
what their highest (or lowest) trade was before that contract expired,
as well as when that trade occurred, how big the move was, and finally, what
it meant in terms of one futures contract. If this table makes glaze over, the
most pertinent column is "Change from Aug. 27 close" where you can
easily pick up on the tendency for Bonds to be going up from now to year's
end.
This is not to imply you can just buy Treasury Bonds right now and be
guaranteed you'll make money, just that they tend to be stronger rather than
weaker in most years....Here is what all those years looked like on the
charts....


Here is the current December Treasury Bond contract.....I am
buying it, looking for, initially, 7 to 8 points on the upside....

I think both of these ideas need to be moved on immediately....
I strongly believe last week's action in Copper could easily have been the
"blow off" and, if correct, it would not be uncommon to suddenly
be 10-15 cents off the highs.....
In Bonds, I see the low of several weeks ago as the end of a normal
correction and believe Bonds have now entered their typical year end
upswing...
Give me a call...
Thanks,
Bill Rhyne
800-578-1001
770-514-1993
|
|