|
Croker-Rhyne Co., Inc. |
|
Main Page |
Philosophy | Current
Recommendations |
Newsletter Archives Contact Us
|
|
|
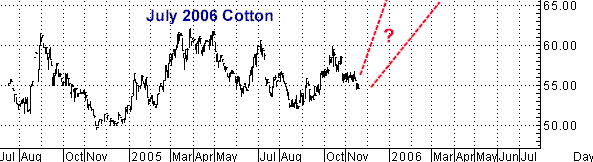
Nov. 18, 2005
Buy Cotton
Random Observations
Futures trading oftentimes requires a lot of patience in that
there are trades you can "see" are coming, but once you're on
them, weeks and months can seem like forever, if, as in this
case with cotton, it just keeps going nowhere. I looked back
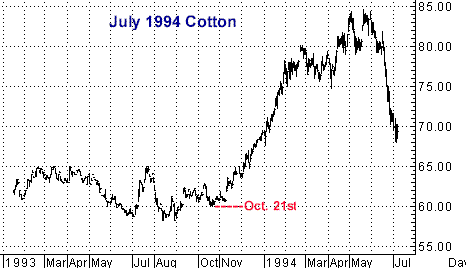
through my cotton histories and found a couple
of fairly recent years (1994-1995) where cotton's action going
into winter was virtually identical to what this year's
contracts have been doing....moving sideways, then
moving more sideways, in the process essentially becoming what I
consider a "coiled spring". In these two previous
cases, when they finally did start moving, the bull moves
were more or less non-stop, moving up 25 cents in 1994 and 45
cents in 1995. This obviously does not mean the
same sort of thing has to happen with the current cotton market
but I do continue to look for, sooner rather than later, the
beginning of a MAJOR bull move in this market and I do think the
move could easily resemble what happened in 1994 and 1995....On
the following four charts, compare for yourself those two July
contracts with the current July 2006 contract....You should be
able to easily note the very distinct similarities between them,
right down to the month by month "wiggles" as they wore out the
most patient of traders....
.
One basic "rule" in commodity trading is that large
consolidations are usually followed by large directional moves.
I believe cotton firmly fits into this category.
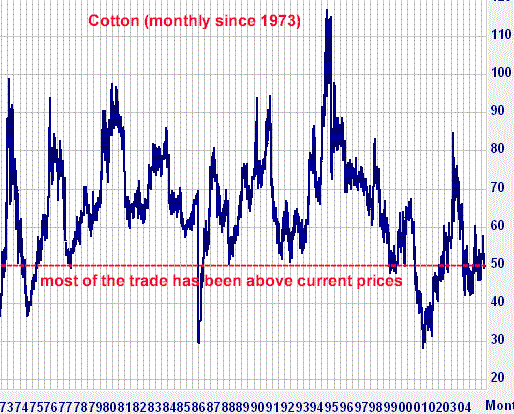
Cotton Prices ARE
historically quite low
As I have pointed out in previous newsletters, during
the past 30 years, Cotton prices have easily spent 90-95% of the
time at prices above current levels. While this
does not mean cotton has to go up, it certainly means the idea
of a bull market is something traders should be prepared for.
During those same 30 years, July Cotton has been
below 60 cents at this time of year on nine occasions. IN EVERY
ONE OF THOSE YEARS, SOME SORT OF BULL MOVE TOOK PLACE BETWEEN
NOW AND JULY'S EXPIRATION (table following).
When July Cotton was below
60 cents
on Nov. 18th during the last
30 years
July 2006 Cotton closed at 54.63
today.
Cotton Does Move
During the past 30 years, July Cotton has has
averaged roughly a 20 cent trading range between now and
expiration. Given that cotton has basically been
sideways for some 16 months, I believe the possibility of
matching that average is extremely high during the next 8
months. Futures are inherently volatile and cotton is definitely
not an exeption to this volatility....While cotton certainly
could go down from here, with US exports running at a
record pace and world consumption doing the same, my own
opinion is it is just a matter of time (short) before this
market fairly explodes on the upside....I may be
dead wrong but I believe the recent "drift" lower should
quickly, and sharply, end any day now.
China
The United States is the world's biggest cotton exporter. China
is the world's largest cotton importer as well as the world's
largest finished goods textile exporter....Even before the
headlines of the last few years associating Chinese demand with
bull markets in various commodities, I had seen them be a major
force in driving individual commodity markets to record levels,
one of those specifically being in 1995 when cotton traded up to
$1.15 a pound....The "Chinese story" generally
only appears in the headlines long after one of those Chinese
influenced bull markets has been going for a long, long
time....I can easily imagine that being the case next summer
when cotton is far, far above today's incredibly undervalued
levels.
I AM BUYING
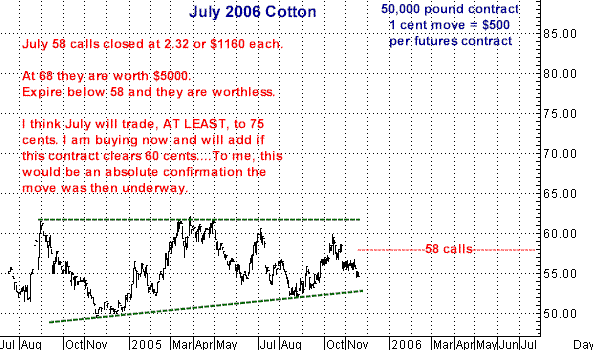
One more time, here's the long term chart.....
More on Treasury Bonds and Gold early next week.
Thanks....Give me a call...
Bill Rhyne
800-578-1001
770-514-1993
|
|
