|
Croker-Rhyne Co., Inc. |
|
Main Page |
Philosophy | Current
Recommendations |
Newsletter Archives Contact Us
|
|
|
July 20, 2007
Here is an update of the Vegetation Condition maps furnished by the
USDA. The scale goes from darker green, indicating the
greatest vegetation development, to grey/dark brown, indicating the
least. There is still a major difference between this year and last
year...And we are still a LONG way from harvest in a number of
markets, meaning weather "scares" by themselves could be enough to
stimulate some big moves in this crop year when world demand is so
strong and ending stocks potentially so tight.
Last Year, July 6 - July 19, 2005
This Year. July 5 - July 18, 2006


Taking it market by market....
Corn
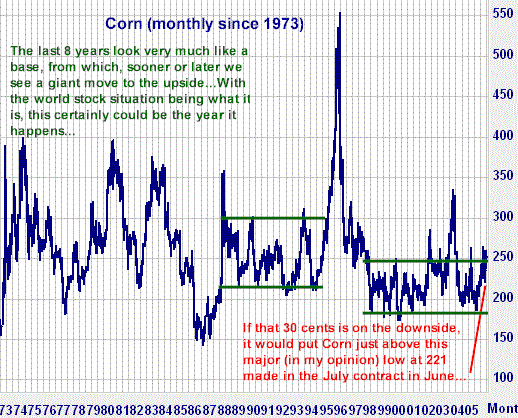
Lots of volatility with shifting weather during the past six weeks.
The roller coaster has my guts turned inside out with the market
swinging back and forth in 30-35 cent blasts, with the most recent
being a 30 cent, six day downturn. I would not be human if I didn't
admit I am scared to death here, but with world stocks as tight as
they are, China on the verge of becoming a net importer and the
weather as dicey as it has been, I definitely want to stay long this
market...At some point, and maybe right here, I believe
Corn will turn up for good and take off toward at least the
$3.50-$4.00 area.
During every one of the last 10 years, December corn has
traded at least 30 cents above or below its July 18 close before it
expired. With Tuesday's (July 18) close at 262 1/2, this says we
should expect to see December trade at least to 232 1/2 or 292 1/2.
The interesting thing here is 232 1/2 would be a new contract low
and 292 1/2 would be a new contract high...All things
considered, I find new lows quite difficult to expect (although
experience has taught me ANYTHING can happen in this business). On
the other hand, if this market were to make new contract
highs, especially after all the recent volatility, I would see it as
a signal Corn was going much, much higher in confirmation of a
definitive breakout from a very large base.
 
Soybeans
Same as corn, but still rocking back and forth in a very tight
range. This crop is far from made and weather is still very much a
factor...During every one of the last 10 years, from
their July 18th close until expiration of the November contract, the
smallest move in either direction has been 56 cents, with 8 of those
10 years having been at least 90 cents ($4500 per futures
contract)...With November having closed at $6.11 on
July 18th, going down 56 cents puts the market at $5.55, and going
up puts it at $6.67...Similar again to Corn, this makes a
strong argument for a break out of the current range....And again,
if it's up, I think it will be big, especially considering the trend
following propensity of the massive funds now all over the futures
markets.
The supply-demand dynamics of Soybean Oil (a derivative of Soybeans)
have been changing with the rapid growth of the BioDiesel industry.
Soybean Oil has been leading the Soybean complex and is
really the horse you are supposed to be on...It can be volatile, but
when it backs up as it recently has, if your conviction is to the
upside, you are supposed to close your eyes and buy it...When
a market has been running, one always fears "buying the high", but
this is the sort of mentality that can keep you out of the real
moves when they happen.
 
Wheat
Today's action in wheat is a good example of why I want to be on all
of these markets. Although it may be of no real import, Wheat was up
12 cents today when Corn, Cotton and Soybeans were all down
slightly...I don't know if Wheat is about to take the lead but this
IS the market where the weather damage has been the most
significant...I have no idea if that damage is already "in the
market" or not...With world wheat ending stocks projected
to be the tightest in decades, I am just assuming this market is no
where near being finished on the upside.
 
Cotton
After making new lows several weeks ago, Cotton has sprung back up
3-4 cents on no particular news whatsoever. I have no idea if the
lows are finally in, but I do know anybody who has even dreamed of
owning this market has been worn to a pulp and are scared to death
to put another dime on the table...which is the way the futures
markets often works when a market is ready to go...I
continue to think the severe weather here and the monstrous demand
from China (they will probably import a quantity of cotton equal to
the entire US crop) is going to hit home anytime now....I still keep
looking at the long term picture and seeing cotton as the most
undervalued essential commodity on the board...It's traded at $1.00
a pound in the past and I think it will do so again in the not so
distant future....I may be dead wrong....after all, I
have basically been making this recommendation for over a year
now...but I think there is gigantic leverage in the
December and/or March call options.
 
Treasury Bonds
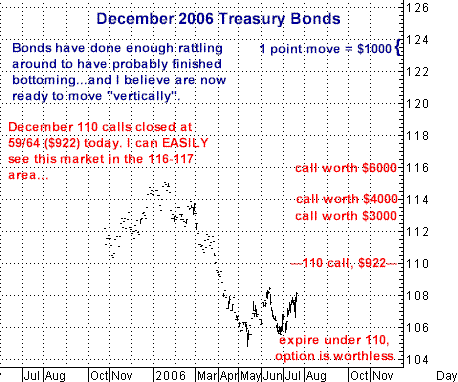
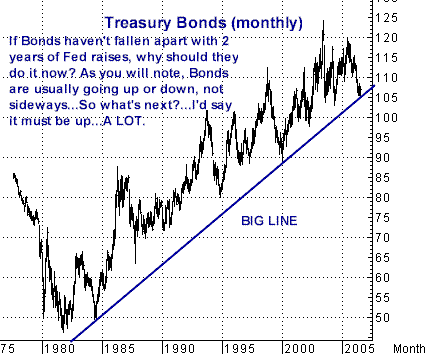
Some of you know how bullish I am on this market...I don't care if
the Fed is or isn't "done". What matters is what they have "done"
for the past two years...Bond prices virtually always turn up well
before the Fed finishes a tightening campaign and this turn appears
to be no different...I'm tired of writing this particular
newsletter, and I'm sure you're tired of reading it, so all I'll say
(again) is I believe there is more leverage in December
Bond calls than I have seen in a market in a long, long time....The
only other thing I'll say (repeat) is I continue to believe there is
NOBODY actually selling government bonds they own... For example,
ifyou owned a Treasury paying 6.5%, guaranteed by the US
government, that you bought maybe 8 years ago and this Bond will
still keep paying you that 6.5% for another 20 years, would you have
ANY interest in selling it?...I doubt it...It would be different if
the Fed had been saying "we don't give a damn about inflation" for
the past two years but that obviously has not been the case....There
are no natural sellers of US Treasuries...and believe me, there are
buyers lined up every day by fixed income investors all over this
planet.
 
Just for the hell of it, here is one very interesting chart....I'm
actually not that big a fan of trendlines (they all seem to get
broken) but I did long ago teach myself, "In the Dow, Trust the
Lines", or the BIG ones anyway....What I note is, the Dow
is on a 24 year trendline, going back to when this whole thing
really cranked up in August, 1982...Seems like there
are a zillion reasons to dislike the stock market right now, which
leads me to think this might be a really, really big place to be a
buyer....Just looking at the chart below, if we were
to get started on the upside, two or three thousand points would
appear to be "small change"...From a purely technical standpoint, I
would have to say this chart has a potentially EXTREMELY explosive
look to the upside, while also understanding what you may have here
is a massive "double top" (which would not be good news for our
lives in general)....One thing is certain (in my opinion)....WE ARE
LONG OVERDUE A LARGE PERCENTAGE MOVE AWAY FROM THIS 11,000 AREA.

As usual, give me a call if you want to talk about anything
here...or anything at all for that matter....
Bill Rhyne
866-578-1001
770-425-7241
|
|