|
Croker-Rhyne Co., Inc. |
|
Main Page |
Philosophy | Current
Recommendations |
Newsletter Archives Contact Us
|
|
|
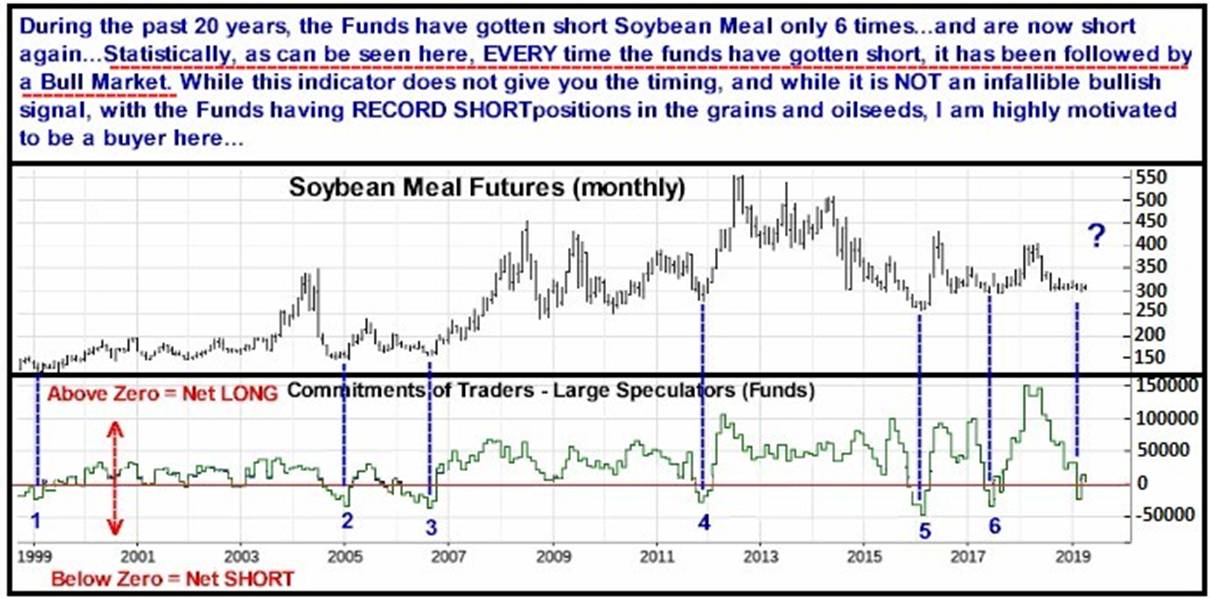
April 24, 2019 A few “philosophy of trading” statements… What I try to do here is show you the principal factors that lead me to the trade recommendations I make… I also try to make it clear that being wrong IS part of this business. As I have posted in BIG print on my office wall as a reminder: YOU WILL BE WRONG. YOU WILL BE RIGHT… This statement subsequently leads me to my very strong trading belief that WHAT HAPPENS WHEN YOU ARE WRONG IS FAR MORE IMPORTANT THAN WHEN YOU ARE RIGHT, which is precisely why I routinely recommend using the “Both Sides Strategy” (BSS), in which call and put options are bought, usually at a 2 to 1 ratio in both directions in a market, in that it DOES give you the possibility of recouping your original investment when you are wrong…while at the same time providing you with opportunity to make solid profits when you are right…This is NOT to say that it WILL get you all of your money back, but that it does offer the very real possibility of doing so, with its one principal failing being that if a market has gone absolutely nowhere by the time your options expire, you could also definitely lose 100% of your investment…However, the truth is, as an options buyer, this is always where my greatest danger lies. If a market goes nowhere, whether I am buying one side or both sides, it will generally mean losing money…To be clear, the approach is NOT infallible, but using the BSS does offer a bit of “insurance” when the market goes the wrong way. Quite honestly, I long ago realized that the simple math of how options change in value is probably far more important than my opinion as to market direction…that what really matters, using the BSS, is how far a market needs to go the “wrong” way before you are able to recoup 100%, and on the flip side, how far it needs to go to make at least about triple what you’ve spent for the entire position...with the answers being, in both cases, that you don’t want to be taking a position where simple calculations tell you the market has to make a relatively gigantic move to work out for you. To be more specific: Before I make a trade, what matters most is the total costs of buying options on both sides relative to what statistics and historical studies suggest is a definitively possible movement expectation in that market…that is, will a relatively small movement against me provide the opportunity to recoup 100%? And does a relatively normal sized move in the “right” direction have the potential to make at least 3 times what I have spent? All that being said…It does NOT mean the trade outlined here, Buying Soybean Meal, will be profitable…but I will start here by saying I see this as statistically being probably the best set up for the BSS I have ever seen as a trader…by the numbers…EVER…which obviously is a very strong statement…but again, just as obviously, does not insure success. So here is my research…This is what I see…These are the factors that I think make this a great trade…the reasons that, in early 2017, I wrote, “This is a trade I think I will take every year for the rest of my trading life.” So again… Using the Both Sides Strategy (absolutely) I AM BUYING AUGUST 2019 SOYBEAN MEAL First up, Soybean Meal is the world’s single largest ingredient in feed for Livestock (like Cattle, Hogs, & Chicken) and actually accounts for more than 70 percent of the protein source used in compound feeds for those animals. In other words, its importance in producing the world’s animal protein cannot be overstated. Its production and consumption is ESSENTIAL to feeding the planet. Before presenting the long term price movement statistics that are the basis for this trade, I will repeat what I’ve been saying for some time now…that I believe that it has been decades since I have seen overall market sentiment as bearish towards US crops as it is now…Of course, there certainly is some bullish opinion out there, but generally speaking, all I seem to hear and read are recommendations that are primarily advising, regarding any rally in Corn, Wheat, Cotton and the Soybean Complex, “Be ready to sell at ____”, or projections about how much lower prices could fall…with virtually ZERO projections as to “how high” these markets could go…And no big secret—This is the way it has been at every market bottom I have ever seen. Large Speculators (funds) have only been net short Soybean Meal 6 times in the past 20 years… Along those same lines, Large Speculative Funds are currently holding a record cumulative short position in Corn, Wheat and Soybeans…a situation that I believe not only reinforces the idea that sentiment is overwhelmingly bearish…but also presents the eventuality of those funds having a LOT of buying to do when these markets DO make their inevitable turn back up…And specifically in Soybean Meal, the following chart is, I believe, self-explanatory.
I know that charts can put some people to sleep so I will put it in in plain English…For the past 20 years, every time the funds have actually reached a net short position in Soybean Meal, it has precluded some sort of bull move…and I see no reason to expect anything different now…ESPECIALLY now really…in these times of high volatility, political uncertainty, and ENORMOUS amounts of money sloshing through the markets…But just to be clear, this indicator, like any indicator does NOT mean a rally is bound to occur anytime soon.
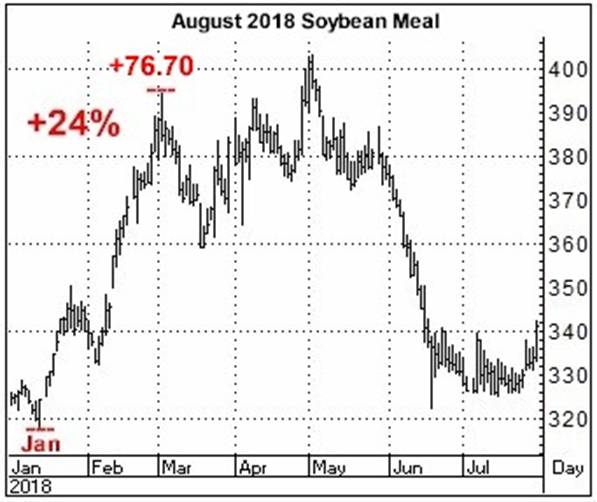
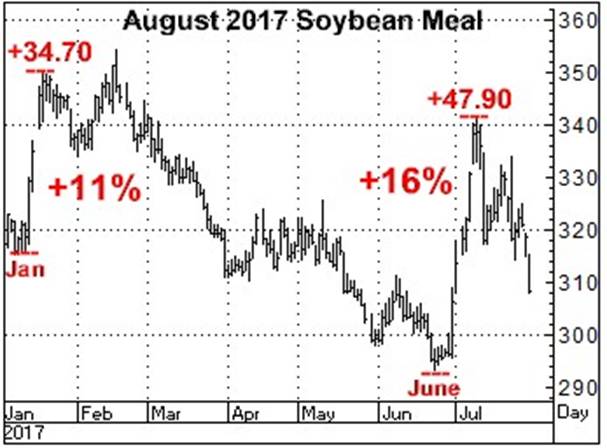
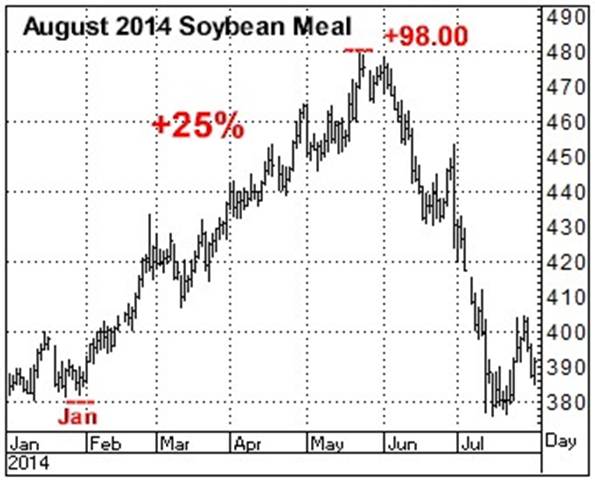
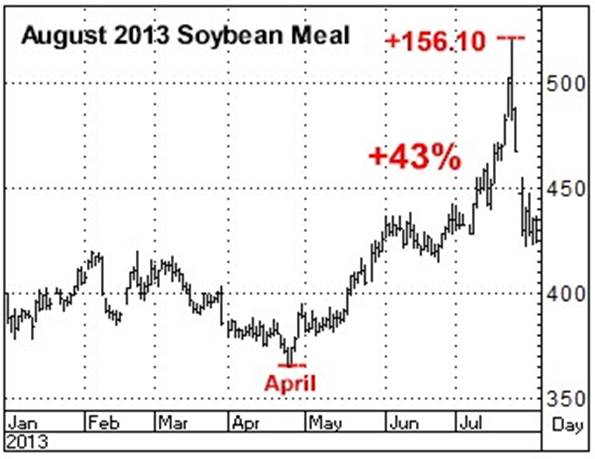
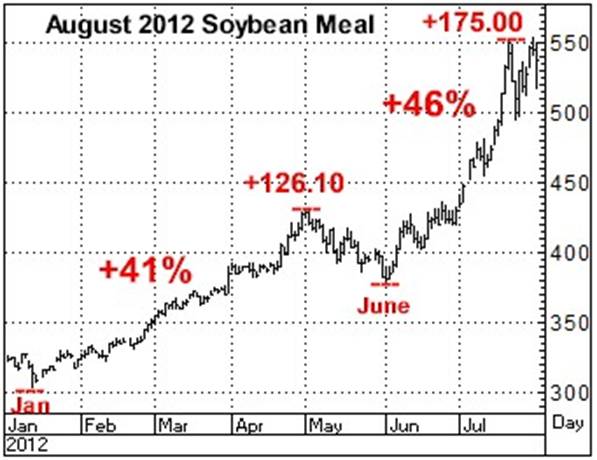
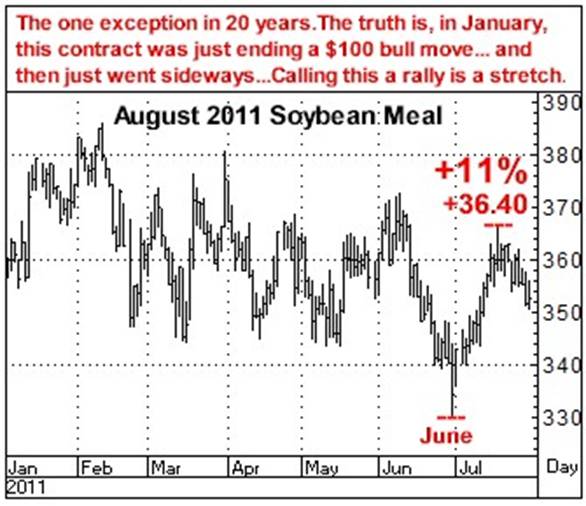
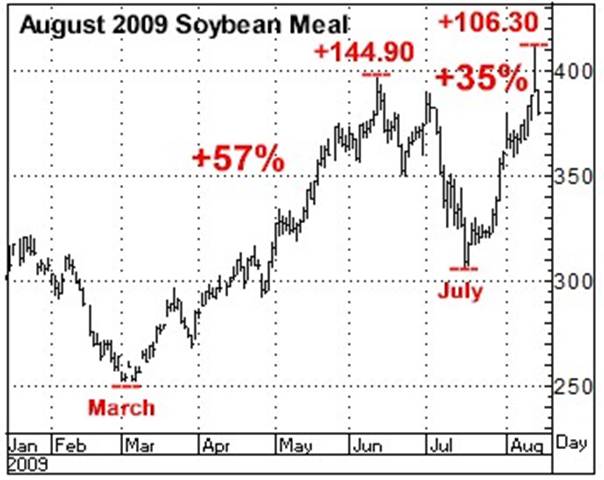
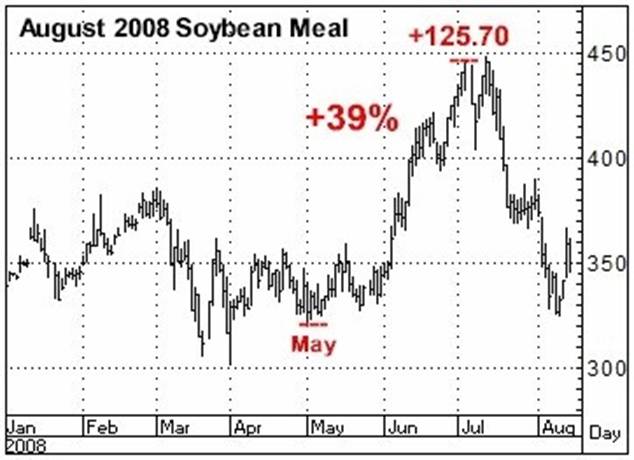
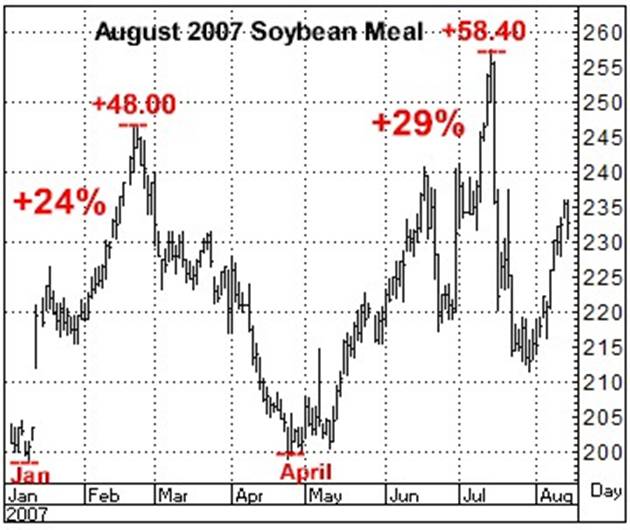
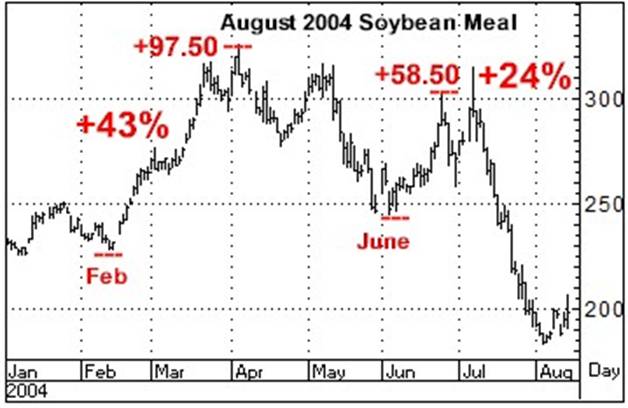
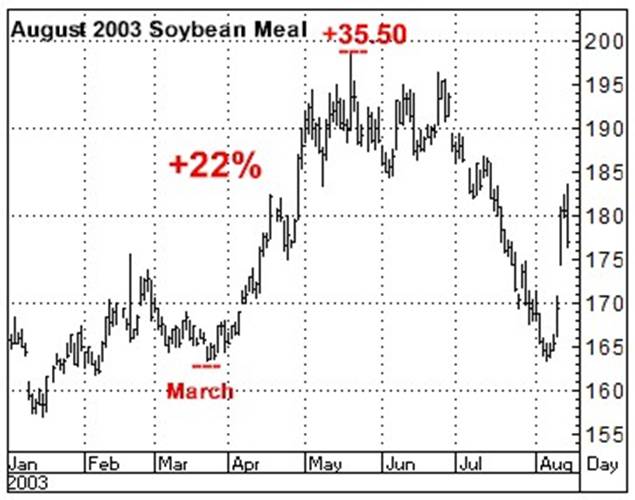
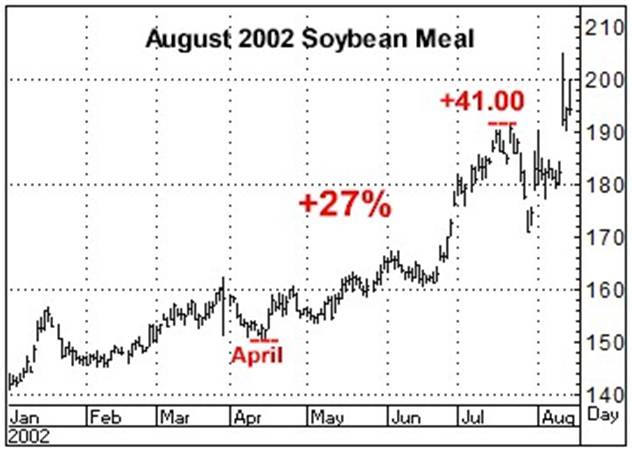
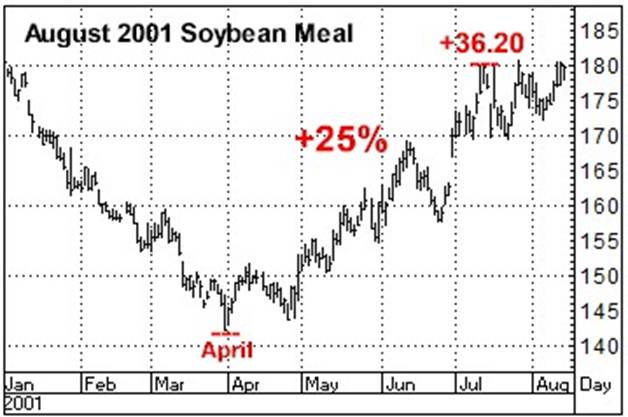
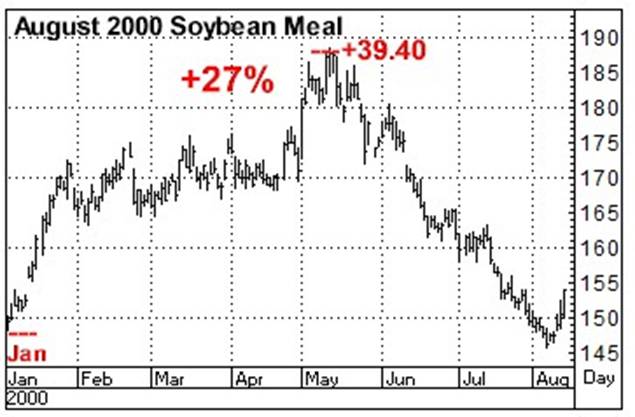
The Principal Point of this Newsletter… It does NOT mean it will happen this year, But Soybean Meal usually has SOME sort of rally between January and August What follows are charts of every August Soybean Meal contract… going back to 1999 (20 years) between January 1st and expiration. On each chart I have noted whatever notable rallies have taken place during this 7 month timeframe…How big they were in actual price and futures contract dollars…And most pertinently, the upward percentage change in value of each contract. And finally, the month in which each rally began. While it absolutely does NOT mean this will be the case in 2019, what I have observed is that this market has a DECIDED tendency to put up at least one strong rally between January 1st and contract expiration…that the moves are often quite direct…and often NOT small…And then to note, that so far THIS YEAR, the August 2019 contract has done nothing more than trade sideways. Again, it does not mean it will happen, but we have yet to have ANY rally…And my bet is that we WILL.
SOYBEAN MEAL (feed for livestock) IS A 100 TON CONTRACT, AND IS QUOTED IN DOLLARS PER TON… THEREFORE, EVERY $1 MOVE IN SOYBEAN MEAL = $100 PER FUTURES CONTRACT – OR – EVERY $10 M0VE = $1000 PER FUTURES CONTRACT So, I would ask you to note the size of the moves, when they began…and how they actually did make the bull move…which, as can be observed, is often relatively straight up… PAST PERFORMANCE IS NOT INDICATIVE OF FUTURE RESULTS. THERE IS NO GUARANTEE YOUR TRADING EXPERIENCE WILL BE SIMILAR TO PAST PERFORMANCE. WHATEVER THESE CONTRACTS HAVE DONE IN THE PAST DOES NOT MEAN THEY WILL SO ANYTHING SIMILAR IN THE FUTURE. All 20 of these charts were created using Aspen Graphics
Here is a summary of what is on all those charts… PAST PERFORMANCE IS NOT INDICATIVE OF FUTURE RESULTS. THERE IS NO GUARANTEE YOUR TRADING EXPERIENCE WILL BE SIMILAR TO PAST PERFORMANCE. WHATEVER THESE CONTRACTS HAVE DONE IN THE PAST DOES NOT MEAN THEY WILL SO ANYTHING SIMILAR IN THE FUTURE. Rallies in August Soybean Meal, January to Expiration, Past 20 Years
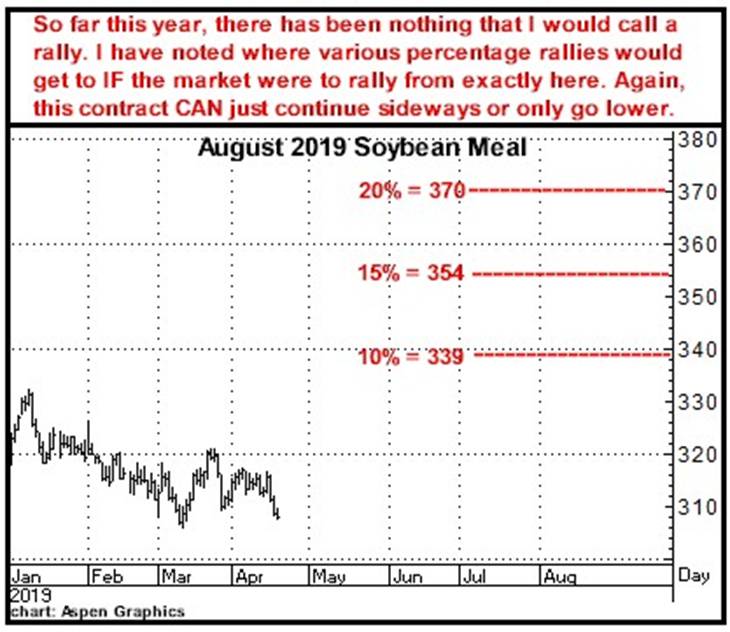
And this is what really stands out to me… 19 of the last 20 years there has been at least a 11% rally. 18 of the last 20 years there has been at least a 22% rally. 7 of the last 20 years there has been at least a 30% rally. The next chart shows you what the current August, 2019 contract has done so far this year…which is basically NOTHING…which I think will change…And I might be dead wrong, but per the history here (which again, does NOT mean a rally will occur and could mean losing 100% of your investment) and the positions of Funds, MY opinion is that we will see AT LEAST a 20% rally before this contract goes off the board.
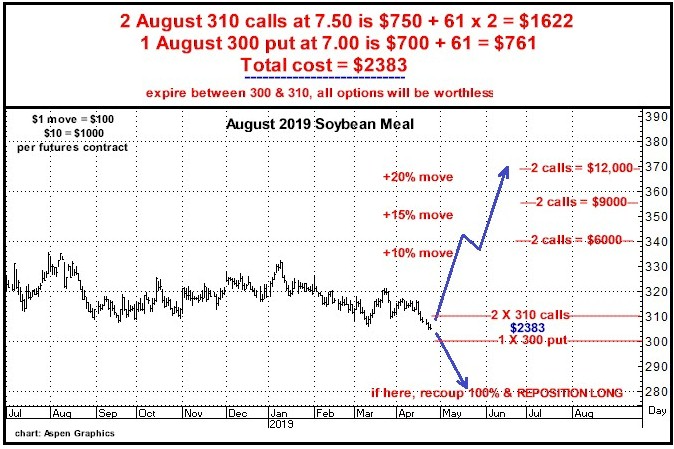
If you assume an objective of a 20% rally, between now and expiration, you are talking about a roughly $60 move. My premise is that SOYBEAN MEAL WON’T STAY HERE. These are volatile times…Between the Large Specs being short, potential weather, politics, or simply the fact that we do have record world demand? I think betting on a rally is a smart move here…ESPECIALLY if you use the 2 & 1 options approach outlined below. The numbers will change daily but here is what they look like at current levels… SO HERE IS THE MATH…WHAT HAPPENS DOLLARWISE IF THE MARKET GOES LOWER, SIDEWAYS…OR HIGHER…
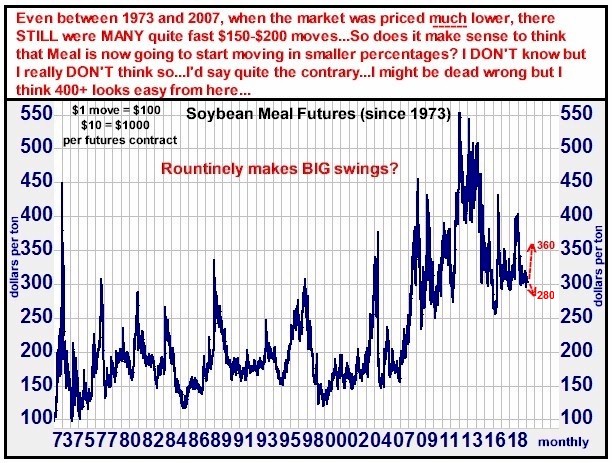
For more perspective, here’s the long term look at Soybean Meal…from which you should easily be able to see what I see…that large percentage moves ARE quite common here…And DO note that the price movement necessary to make the recommended 2 &1 trade “work” would NOT be big relative to what Soybean Meal has been doing for the past 46 years. As always, however, I am obligated to tell you that if the market doesn’t move, you could lose every dollar you have invested.
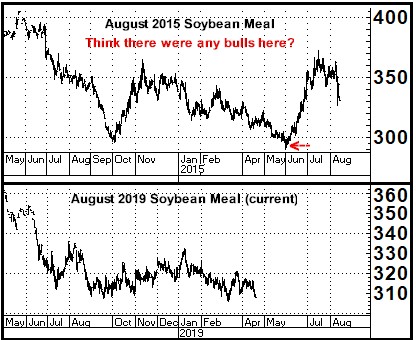
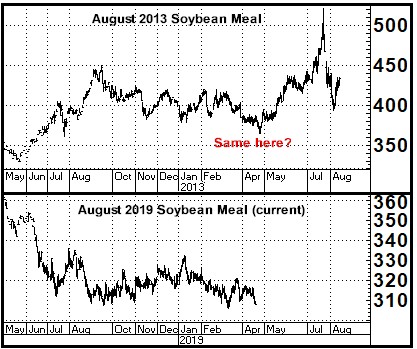
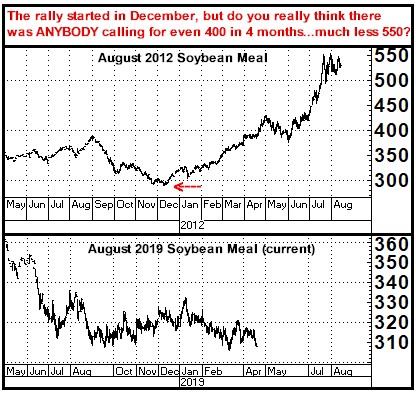
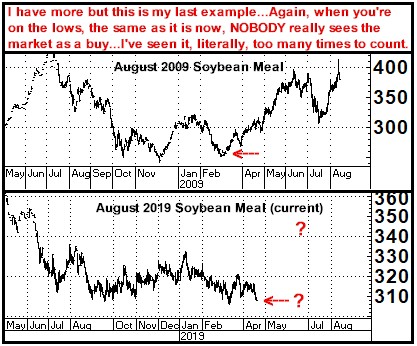
Some years have been similar to what August looks like today… And just to give you a bit more of why I am making this trade, here are more extensive looks at some of those historical contracts above that I think have similarities with the current August contract…in that, they were all drifting sideways to lower for quite some time…and then, out of the blue (which IS the way it so often happens in this business), significant rallies got started (and I assure you, NOT due to some specific news event) and never looked back…And do be aware that just because these similar contracts all had strong bull moves, does NOT mean that the August, 2019 contract will do the same…As always, I could be dead wrong about everything I am predicting here, which could mean losing 100% of what you have invested.
That’s all I have…except to give you one more look at the position I would recommend here…And also to say there are other option combinations that can be used…as well as, just using straight up futures contracts.
As always, these are my opinions…And as always, I might be totally wrong about everything I think. Give me a call if you want to talk about any of this… Thanks, Bill 770-425-7241 866-578-1001 All option prices in this newsletter include all fees and commissions. The author of this piece currently trades for his own account and has a financial interest in the following derivative products mentioned within: Soybean Meal |
|