|
Croker-Rhyne Co., Inc. |
|
Main Page |
Philosophy | Current
Recommendations |
Newsletter Archives Contact Us
|
|
|
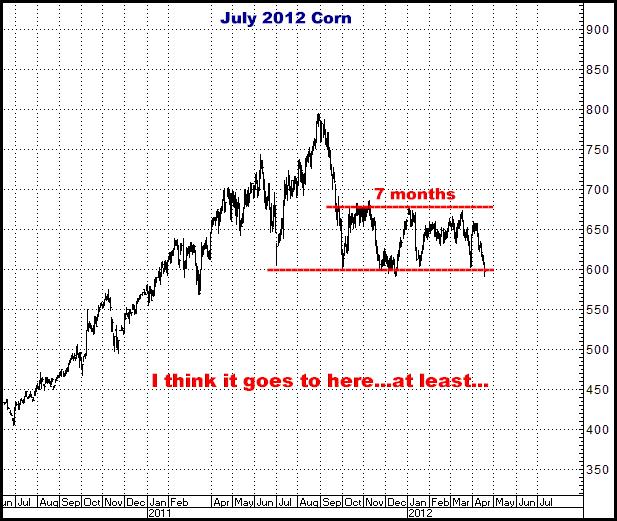
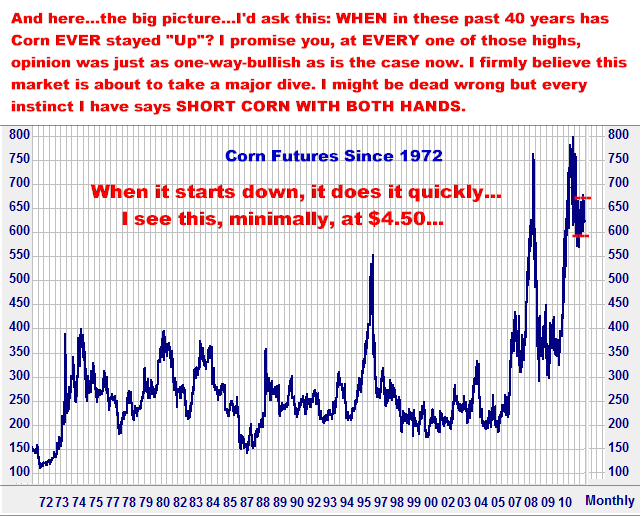
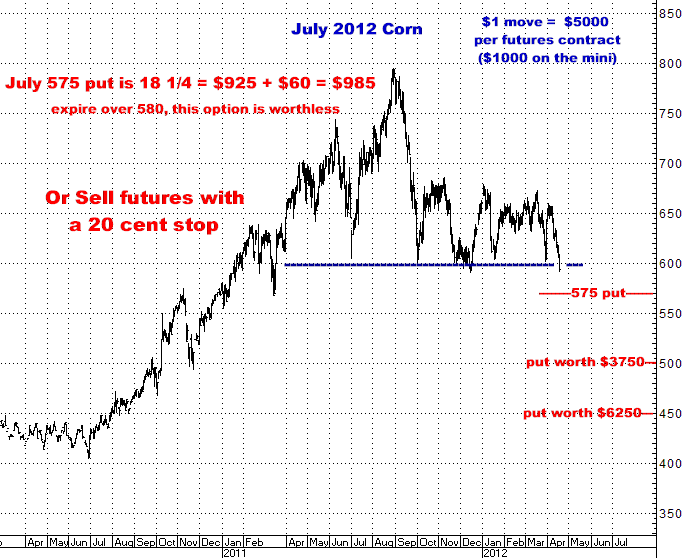
April 18, 2012 Short July Corn NOW and KEEP shorting it... A LONG time ago, with the absolute conviction the same situations come up over and over again in futures trading, I did a study in search of what I considered to be the highest probability type of trade I could find. My conclusion became, without question (from my standpoint), the very best trade is find a market that has been sideways within a well defined range for an extended period of time, and to then “go with it” in whichever direction it comes out of that range, whether the move be up, or down. Just position in the direction the market is then “pointing”. My conclusions were based on observing literally 1000’s of charts and very simply noting two principal factors: One - Large sideways movement is often followed by sharp, big one directional moves when a market finally does leave a lengthy consolidation. Two - A market that violates significant lows established over a long period of time tended to keep going lower, and vice-versa for a market taking out previous significant highs…Going a step further, as most markets tend to fall much faster than they go up (due to a variety of reasons related to the fact most traders prefer to be buyers), I would also note that shorting a market making new lows seemed be an even better trade than buying a market making new highs. Both of the these observations go hand in hand with a simple (but needs to be stated) concept: The primary objective in trading is to be positioned in the direction a market is moving. Several years ago, while I was living (dying really) with an endless consolidation in Soybean Oil, I put together a study of historical charts that represented my “proof” that this specific shorting opportunity does occur over and over in the commodity markets. That study, covering the last 20 years in the traditional commodities only (no currencies, financials, stock indices) follows here…The study, I believe, is self explanatory. Before you begin, here is what the July, 2012 Corn contract looks like at today’s close (down 13 ¼ cents or $662 per futures contract). I’d suggest you set this “picture” in your mind and then compare it to the 40 odd examples I have posted below.
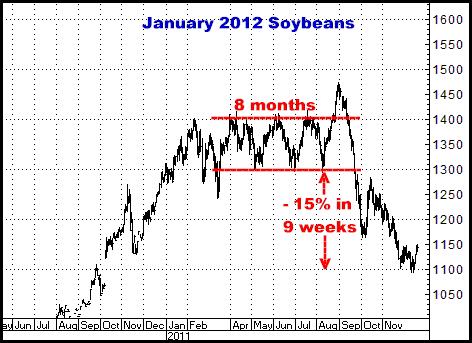
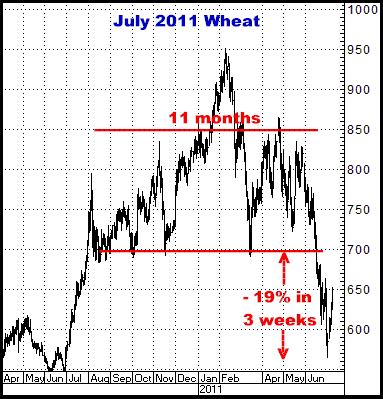
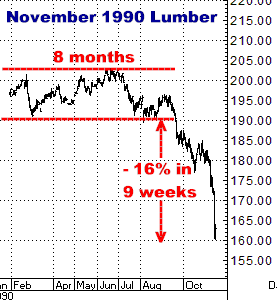
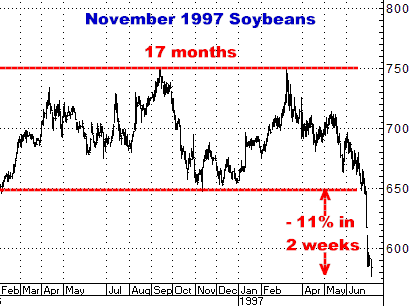
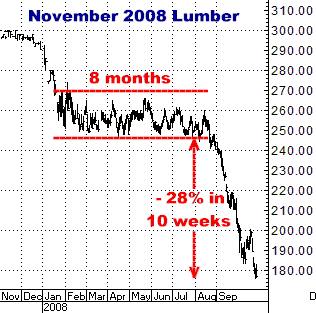
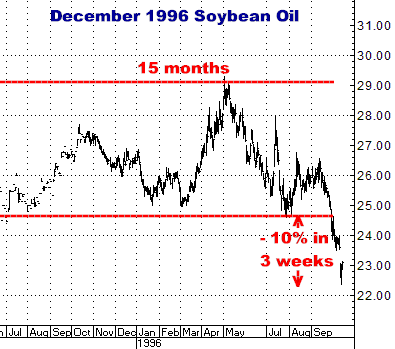
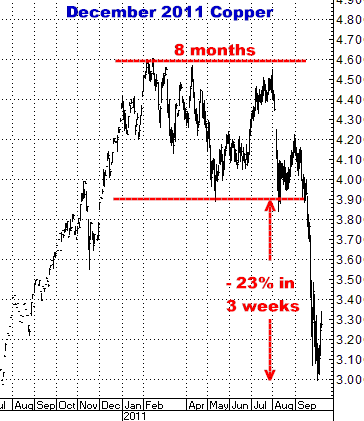
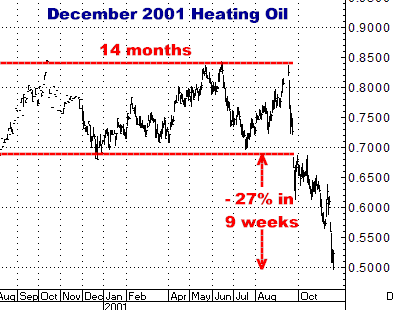
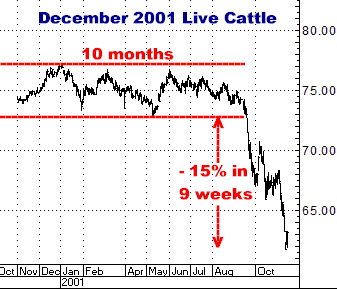
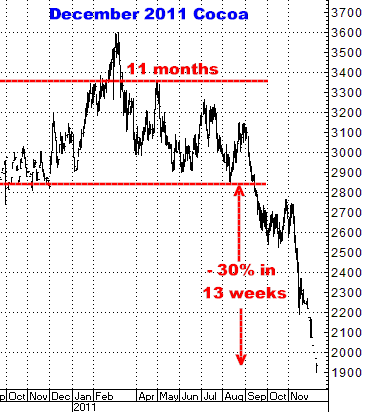
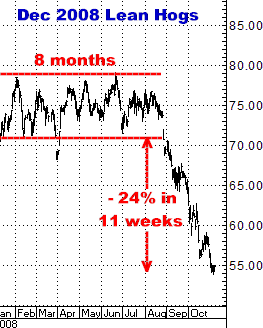
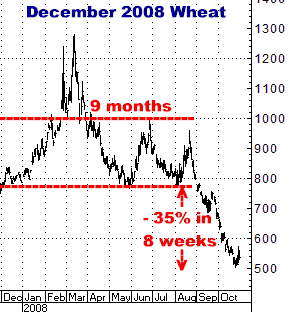
Historical Study of Sideways Ranges That Ended Sharply Lower These are examples of markets that traded consolidated sideways for quite a long time, "doing nothing", then broke to the downside. I have noted the length of the sideways move at the top of each range, then noted the percentage loss in each market, FROM where it took out its previous significant low (or lows), as well as how much time the down move took to complete. I should also point out I do not mean to imply every long sideways move ends by going down, nor would I suggest that the move I anticipate in Corn is necessarily going to be as big or fast as some of the action you see in these examples…but history suggest it certainly could be…And again, what I’m asking you to do is compare all of these “set ups” to the one we have in the Corn market today…
Here is one way to do it…
I think this is beginning to happen NOW. If you think this idea makes sense, if you have the risk capital, and if you believe the risk here is worth the potential reward, I urge you to give me a call immediately…Many of you HAVE seen and participated in this type of trade before with me, and will perhaps understand that waiting around “to see what happens” is not what you should be doing now…Oftentimes, markets breaking into new lows get out of the gate quickly and just keep ripping…I obviously don’t know if this is the case now, but I certainly think it could be…And I am trying to be all over this trade...Do something with it... To me, this is a classic. Give me a call… Thanks, Bill 866-578-1001 770-425-7241 |
|