|
Croker-Rhyne Co., Inc. |
|
Main Page |
Philosophy | Current
Recommendations |
Newsletter Archives Contact Us
|
|
|
April 12, 2021 GET SHORT SOYBEANS They have dropped 30 cents in the past two days… According to every analyst I see, this is NOT supposed to be happening… After the ENDLESS ultra-bullish rhetoric regarding Soybeans over the past few months…And with virtually every agricultural analyst I can find calling for at least $17 (with all of those guys sounding like $17 is almost a certainty)…And even with talk of “running out of Soybeans this summer,”…Or after the supposedly roaringly bullish March 31st report that sent them limit up 70 cents several weeks ago…What, according to all those bullish “experts” is NOT supposed to be happening is what I believe we ARE now beginning to see…which is an absolute rollover in prices…with the market closing down 20 cents today and now being fully 75 cents off its high. One more time…Believe me, with the TONS of bullish “logic” out there, this is NOT supposed to be happening…And I can only view the action during the past few days as constituting a very strong indication that Soybeans ARE now about to “roll off a cliff.” Markets DO top out when everybody who would buy, HAS bought…and I will repeat that with pretty much EVERY speculator, farmer, analyst and end user there is having been lately, and ABSOLUTELY, convinced that there is nowhere to go but up, I think that is where we are…I FIRMLY BELIEVE THAT THE SOYBEAN MARKET IS JAMPACKED WITH LATE COMING BUYERS…JAMPACKED WITH THE SAME ANALYSTS AND PEOPLE WHO WERE RESOLUTELY BEARISH FOR THE MAJORITY OF 2020...AND THE NEXT THING WE’LL SEE IS ALL OF THOSE PEOPLE SELLING AS THE MARKET FAILS AND THEY ALL HEAD FOR THE EXITS…AND I THEREFORE CONTINUE TO LOOK FOR AT TRADE DOWN TO, AT A MINIMUM, THE $11.50 AREA. I might be dead, dead wrong, which can mean losing every dollar you invest, but I think this is BIG, BIG trade…and I think it is NOW in gear on the downside…and if history is any guide at all (and it is entirely possible it may not be), according to what I’ve personally seen during the past 40 years, WE COULD EASILY SEE A 20+% SELL OFF BEFORE WE GET TO JUNE…OR ROUGHLY $3.00 PER FUTURES CONTRACT. I won’t show you those 40 years of Soybean chart tops that I’ve published three times now…but I will show you the numbers of what is on those charts…And remind you that EVERY SINGLE ONE OF THESE SELL-OFFS STARTED WHEN THE NEWS WAS NOTHING BUT BULLISH…as I have yet to see it happen any other way. Soybean Tops since 1979
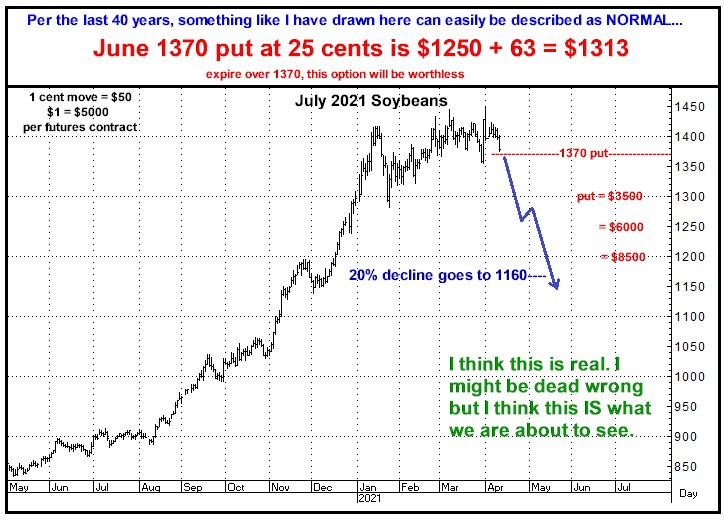
Here’s the current picture…and I think the sell off is IN GEAR NOW…This is the option I would buy tonight or tomorrow…
Nothing else I can say. Don’t just watch. Pick up the phone and do something with this… Thanks, Bill 770-425-7241 866-578-1001 All option prices in this newsletter include all fees and commissions. All charts, unless otherwise noted, are by Aspen Graphics and CRB. The author of this piece currently trades for his own account and has a financial interest in the following derivative products mentioned within: SOYBEANS
|
|