|
Croker-Rhyne Co., Inc. |
|
Main Page |
Philosophy | Current
Recommendations |
Newsletter Archives Contact Us
|
|
|
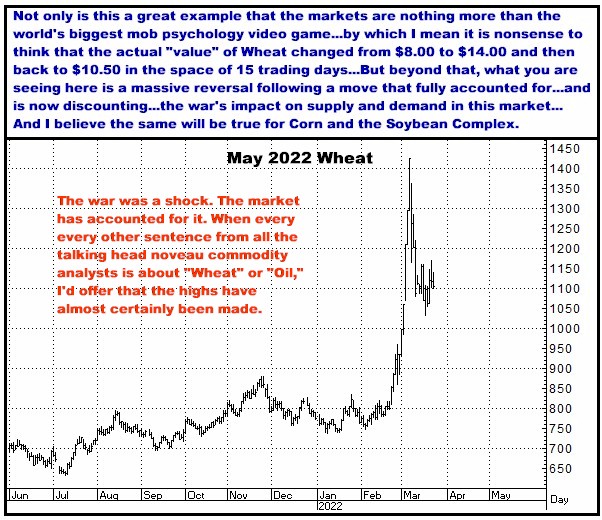
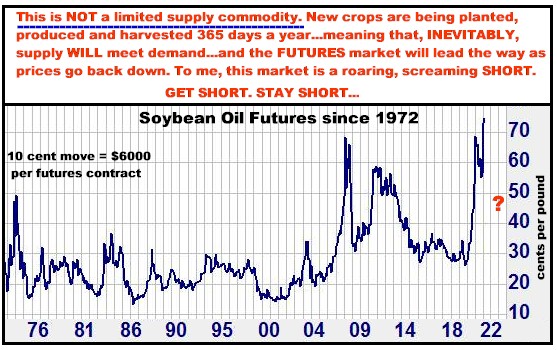
March 24, 2022 Maybe I’m dead wrong, but I see this tandem as a ONCE A DECADE OPPORTUNITY I long ago learned that the when you “know” you should be making a trade, but are scared to death to do so…”knowing” that you will probably lose money (or MORE money)…is exactly when you DO MAKE THE TRADE. I also learned that when every analyst with a pencil is saying, “There is nothing that could make this market go down right now,” IS precisely when you DO GET SHORT. It might seem counterintuitive, but when there is “NO reason to get short” IS when you do get short. Since the Ukraine invasion started on February 24th, the news regarding Crude Oil, Corn, Wheat and the Soybean Complex has been non-stop bullish…and yes, the initial reactions in the markets to this “Black Swan” event were very bullish…BUT with Crude Oil and Wheat, supposedly the two commodities most directly impacted by the war, having seen MASSIVE reversals from their highs March 7th highs, it would be naïve to not understand that FUTURES MARKET PRICES HAVE ALREADY ACCOUNTED FOR THE BULLISH COMMODITY MARKET EFFECTS OF THIS TEMPORARY GEOPOLITICAL EVENT… and quite similar to what typically happens following a drought (wherein production is also unexpectedly slashed, virtually overnight)…is that prices initially, and rapidly, surge to account for the losses…and then go STRAIGHT BACK DOWN…
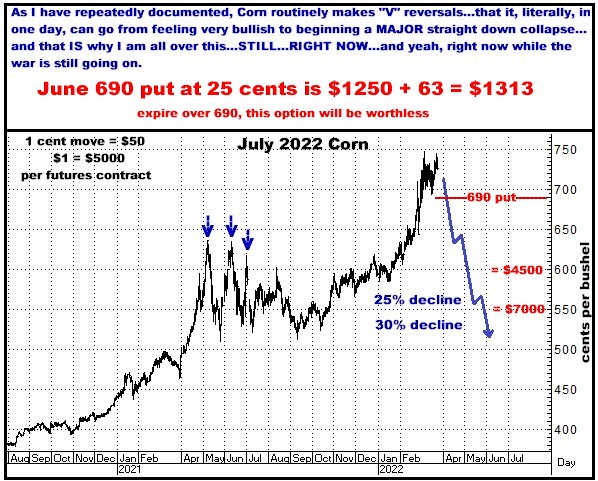
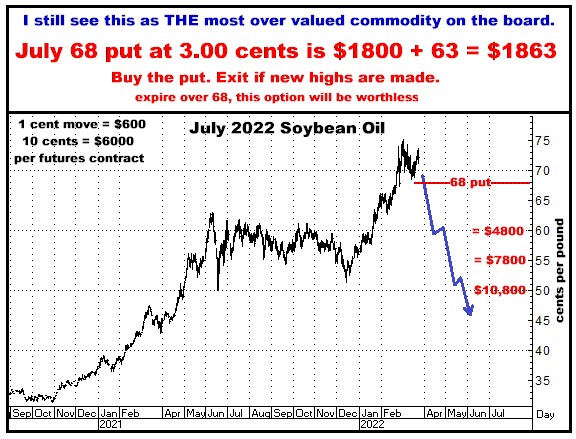
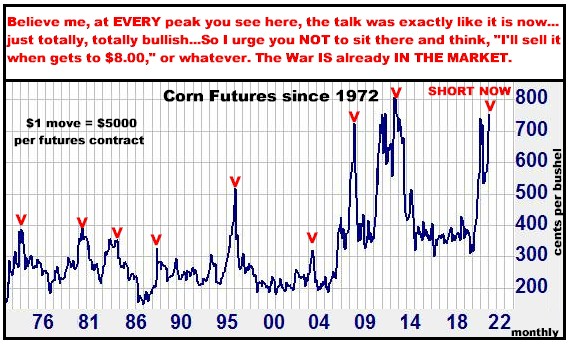
Let’s get real…Both Corn and Soybeans have recently reached stratospherically high prices due to Ukraine…and nothing else…and my read is that the rhetoric surrounding those markets has absolutely become, as noted above, “Nothing will make them go down from here. You must be nuts if you truly think these markets should be shorted here.” But I’ll state categorically that sharply higher prices in the crops has NEVER been a permanent condition…and I don’t think today is any different…And per the math of what the typical 25-30 percentage declines from tops in Corn and Soybeans have been for the past 50 years, to now be minimally anticipating $2.00 in Corn and $4.00 in Soybeans on the downside is absolutely a realistic expectation…with those numbers respectively meaning $10,000 and $20,000 per futures contract in these two markets. And that IS what I am looking for. Buy Corn and Soybean Oil Puts as “unit” And as I have repeatedly pointed out, tops in both of these markets tend to just CRASH out of the gate, bolting down HARD from one day to the next, and more often than not, on ZERO news…So you really do need to be there before it starts…and not be in the position of chasing the market, or wondering, “How do I get on it now?”, or worse, JUST WATCHING it fall apart.
Buy both of these puts in pairs…$1313 + $1863 = $3176 total…Thereafter, if either market makes new highs, sell the option at a loss…but immediately be prepared to buy puts again on ANY sign that the downturn might be beginning again…for example trading back down 10-20 cents in Corn or 100-150 points in Soybean Oil…And as always, if the trade does start working, do everything you can to sit tight and let it happen over the next 2-3 months. And just to be clear, I don’t just draw in those potential targets out of some sort of wishing-and-hoping mentality. Having seen many 100’s’s (or 1000’s) of markets make 20, 30 or 40% relatively non-stop moves, I generally only make recommendations in markets that I think WILL have some degree of the same result…which, as I keep noting (table following), has especially been the case in Corn and Soybeans for decades.
A 25% decline in Corn from here would be about $10,000 per futures contract
Corn Tops since 1972 –
The Big Picture…
One More Time…I think it will be YEARS before you see these kind of prices again… And when DO you short a market? When ALL of the genius talking heads are telling you to do the opposite… Call me if you want to do something with this… Thanks, Bill 770-425-7241 866-578-1001 All option prices in this newsletter include all fees and commissions. All charts, unless otherwise noted, are by Aspen Graphics and CRB. The author of this piece currently trades for his own account and has a financial interest in the following derivative products mentioned within: Corn, Soybean Oil, Soybeans
|
|