|
Croker-Rhyne Co., Inc. |
|
Main Page |
Philosophy | Current
Recommendations |
Newsletter Archives Contact Us
|
|
|
February 24, 2023 Maybe this is it…This IS the way Corn and Soybeans “typically” DO start a true collapse…
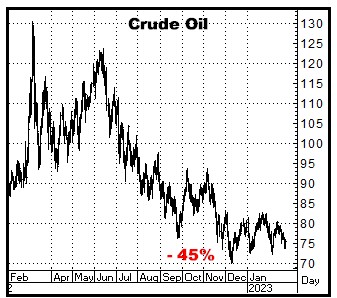
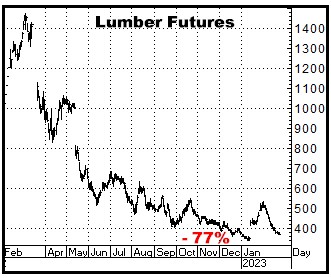
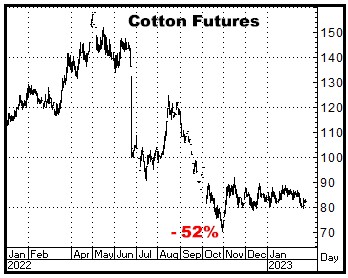
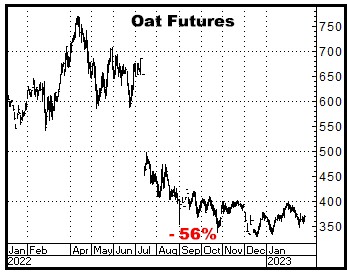
IT AIN’T LAST YEAR…THERE IS NO LONGER ANY QUESTION OF SHORTAGES OF CORN OR SOYBEANS…WHICH ABSOLUTELY ARGUES FOR A RETURN TO MORE NORMAL…LOWER…PRICE LEVELS. I think that the highs seen in any number of commodities last year were THE highs for YEARS to come…that simply stated: The COMBINED effects of the pandemic, years of extremely low interest rates, and then The Ukraine War created surprising and unprecedented supply-demand distortions that took commodity prices to TEMPORARY stratospheric highs…And going forward, I cannot imagine we will even come close to matching those “perfect bullish storm” circumstances…and that all of those markets are, and will be, trending back down to more “normal” price levels. And as repeatedly stated here, any number of commodity markets that rallied due to these distortions have already seen outright price collapses…
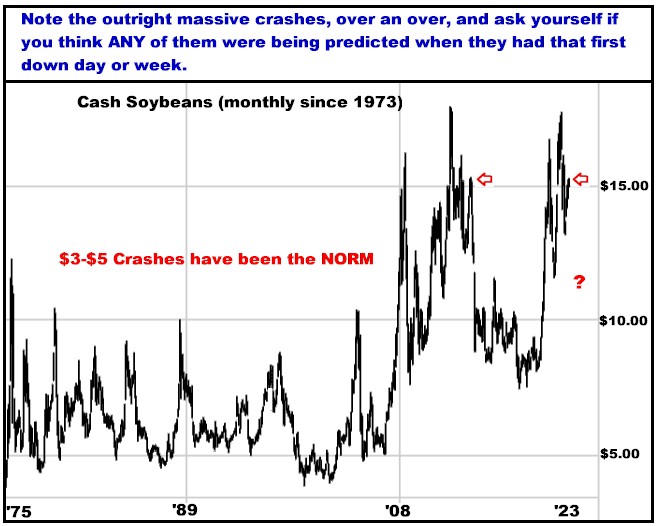
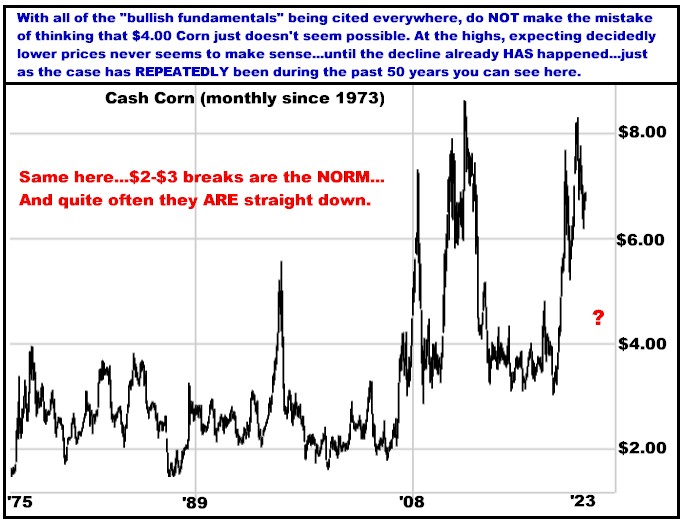
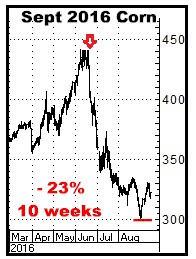
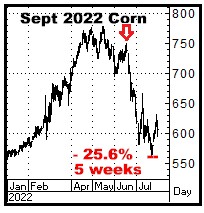
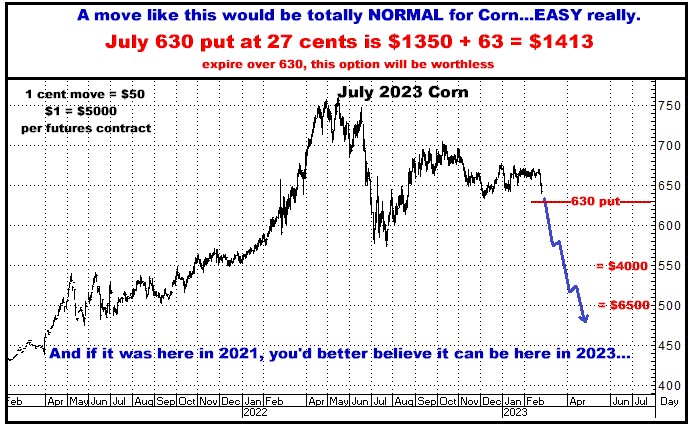
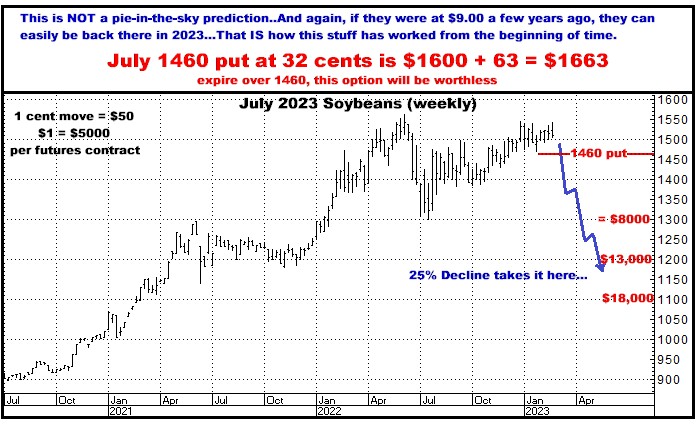
DO understand that NONE of those declines were AT ALL predicted by ANY of the supposed “professionals” in the commodity world… And I believe the same WILL take place in both Corn and Soybeans…both of which definitively appear to have topped out last summer…and have since just traded sideways, which has, I believe, tremendously increased the odds that the big breakdown is dead ahead. AS EVIDENCED BY THE TWO LONG TERM CHARTS BELOW, EVERY BULL MARKET IN THE HISTORY OF BOTH CORN AND SOYBEANS HAS ENDED…MORE OR LESS OVERNIGHT, WHILE VIRTUALLY ALL OF THE ANALYISIS WAS STILL NOTHING BUT SUPPORTIVE…AND THEN HAS GONE RELATIVELY STRAIGHT, STRAIGHT DOWN, TYPICALLY DROPPING 25-30%, MINIMALLY, WITHIN 2-3 MONTHS. I know I have been nothing but a broken record here…or likened to the boy who cried “Wolf!”…but I CONTINUE TO SEE OWNING PUTS IN BOTH OF THESE MARKETS AS HAVING IMMEDIATE AND MASSIVE POTENTIAL.
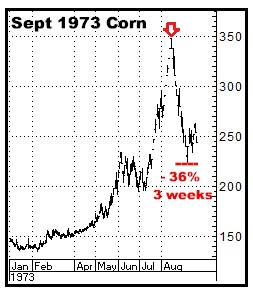
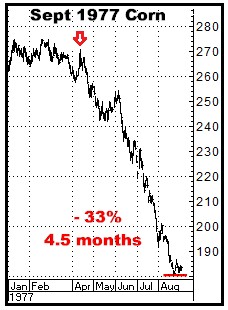
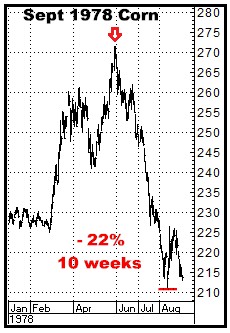
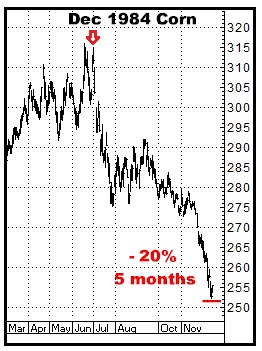
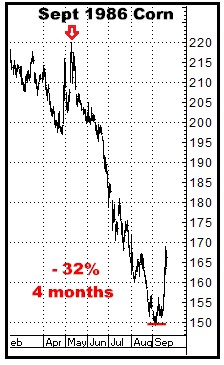
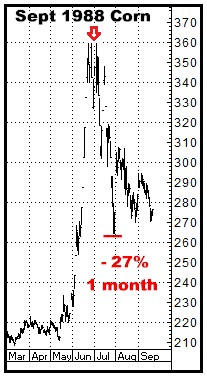
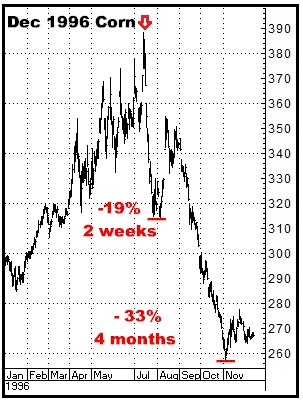
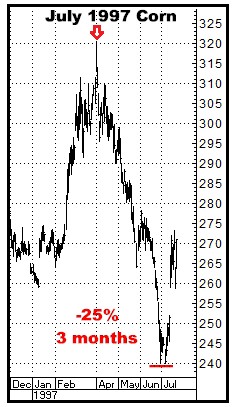
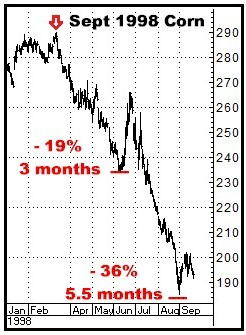
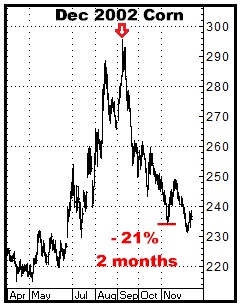
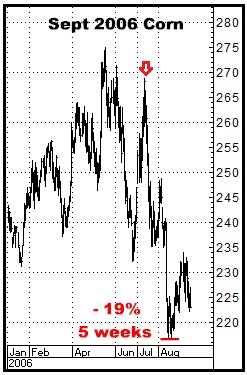
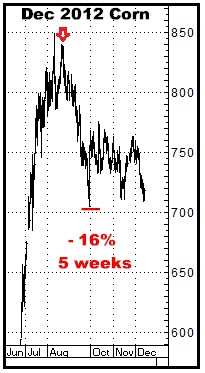
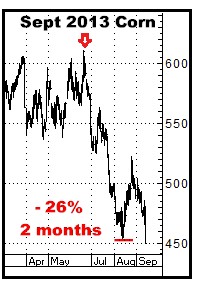
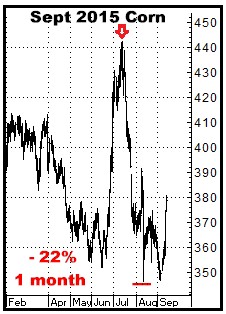
And you can skip over the following 45 charts (going back 50 years) if you want but THEY DO PRESENT THE EXTREMELY CLEAR CASE THAT CORN, LITERALLY FROM ONE DAY TO THE NEXT, AND OFF NO SPECIFIC NEWS EVENT, DOES JUST GO STRAIGHT, STRAIGHT DOWN…pretty much at least once a year…and yes, as I keep saying, when it happens, IT DOES GO DOWN 20%-30% IN A VERY SHORT PERIOD OF TIME. HOW CORN HAS DECLINED FOR THE PAST HALF CENTURY…and Soybeans are very much the same…
Takeaways… Straight down DOES describe how this market declines. Don’t kid yourself…There is NEVER some newsflash that says, “Get short now!” Over and over, it starts with 2-3 sharp down days (again, out of nowhere) that have farmers thinking, “When it rallies again, I am really going to get some selling done.” And guess what? There is NO RALLY…Nothing but lower and lower prices becomes the reality…which eventually spurs heavier and heavier selling. Corn has dropped 30 cents this week off ZERO news…which IS the way it started on almost every chart shown above. Just because I have been wrong about the timing of this major break down does not mean I still am wrong. I’ve been here before. Early. Wrong. And losing money…but I also know what can come next. I THINK THIS IS A GIANT TRADE…and IMMEDIATELY so…
For about $3100, my recommendation is to do them both as a “unit.” Absolutely. ONE GOOD/GREAT TRADE IS ALL IT TAKES… Do this again. All of those histories DO tell the story… Thanks, Bill 770-425-7241 866-578-1001 All option prices in this newsletter include all fees and commissions. All charts, unless otherwise noted, are by Aspen Graphics and CRB. The author of this piece currently trades for his own account and has a financial interest in the following derivative products mentioned within: Corn, Soybeans |
|