|
Croker-Rhyne Co., Inc. |
|
Main Page |
Philosophy | Current
Recommendations |
Newsletter Archives Contact Us
|
|
|
February 23, 2015
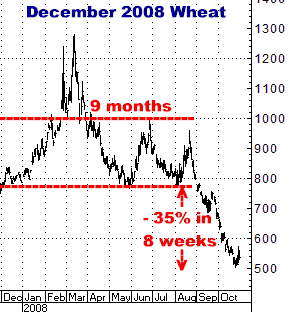
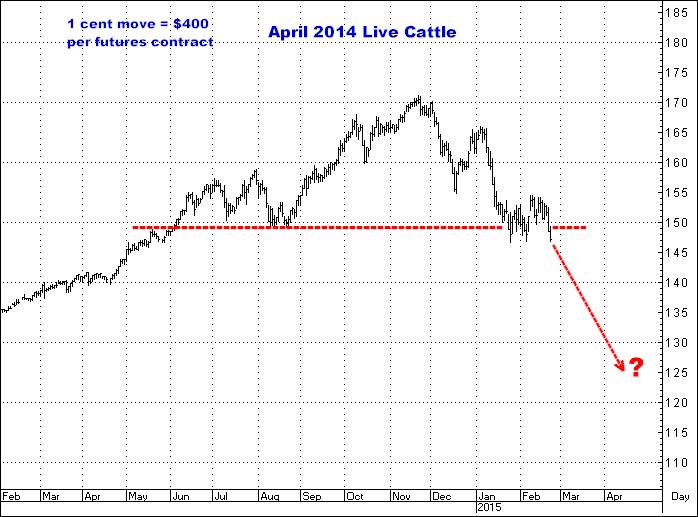
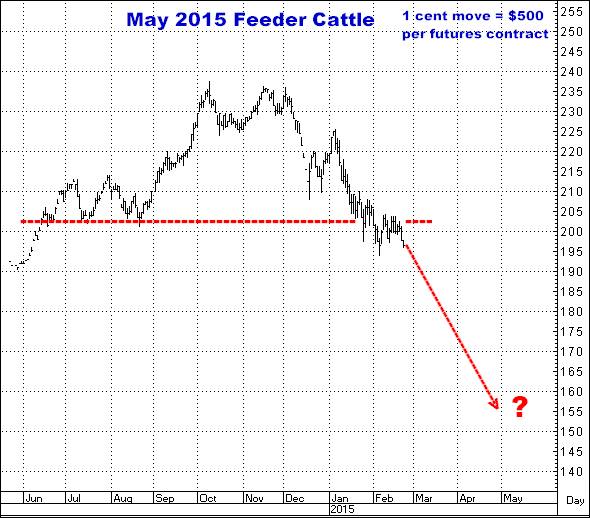
Cattle, down again today… and closer to falling TOTALLY apart? I REMAIN AGGRESSIVELY BEARISH In yesterday’s newsletter I wrote the following: “Some of you will recall that long ago my research led me to ‘discover’ what I call the Perfect Chart…that after researching 1000’s of historical moves, I came up with what I think is the highest probability situation you ever find in futures trading. I won’t go into detail here (but hope to soon) as to specifically what that chart is…but I can tell you the chart below is EXACTLY (and I mean EXACTLY) that Perfect Chart. To be sure, it does NOT mean the trade has to work but it IS the best potential set up I know in this business.” So here is a bit of that research… Simply stated, the Perfect Chart refers to (1) a long sideways trading range…and it does not matter what the market is…and it does not matter how wide the swings are within that range that (2) has finally worked its way back to low side of that range…and (3) hovers for a few weeks, or longer, around those old lows. This is only my own studied opinion, but I say this set up presents you with the greatest probability of the two things most critical to make a big trade, that being, (4) having the direction right…DOWN…and (5) having the very strong possibility of a quite large, relatively fast move. Again, I don’t care what the market is…I have seen exactly this set up, and some degree of an ensuing market collapse, literally, in EVERY market on the board…and I do not care what the fundamentals are, nor what events are taking place, nor what all the talking heads are discussing…THIS SET UP GIVES YOU, I BELIEVE, A BETTER CHANCE TO MAKE A “HIT” THAN ANYTHING I KNOW IN THIS BUSINESS…that more often than not, when these very simple criteria are in place, the next thing you get IS a BIG, RELATIVELY FAST MOVE TO THE DOWNSIDE. That being said, I would add that I do NOT mean this situation comes with any guarantee of success. There are obviously many occasions when this particular situation is followed by a rally, not the collapse I have seen so many times in so many markets. The point of all this is: Both Live Cattle and Feeder Cattle now have EXACTLY what I would classify as the “Perfect Chart”. So take a look at the current Cattle charts…and then compare them to all of the historical examples that follow… These charts were copied from a 2010 newsletter… Historical Study of Sideways Ranges That Ended Sharply Lower These are examples of markets that traded consolidated sideways for quite a long time, "doing nothing", then broke to the downside. I have noted the length of the sideways move at the top of each range, then noted the percentage loss in each market, FROM where it took out its previous significant low (or lows), as well as how much time the down move took to complete. I should also point out I do not mean to imply that every long sideways move ends by going down.

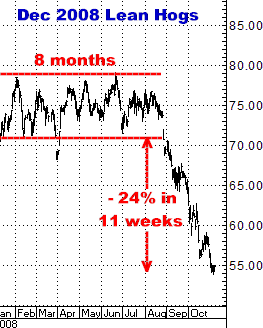
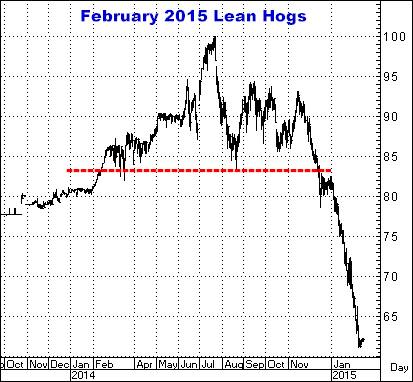
And here are a few quick more recent examples…
OK…So nothing says that Cattle are in this same shape, but I think they are…This is a market that really was THE BULLISH COMMODITY STORY FOR 2015…But just like every bull market that has ever existed, the bull market in Cattle WILL end…and, in reality, probably already has ended. I mean 3 months ago, NOBODY was looking for Feeders to have come off 50 cents or for Live Cattle to have dropped 20 cents. I mean NOBODY. But here we are…I believe sitting on that same cliff you see in those 30 odd examples above, slipping and sliding away a little at a time…but about to accelerate.
Here are the Cattle charts…Decide for yourself if they resemble all those historical charts…and if getting short therefore seems to make sense…And while you’re at it, I would firmly suggest you FORGET any of the bullish story (“lowest cattle numbers in years!”) and just see what you see. I promise you, when (if) we get down another 50 cents, you’ll STILL hear analysts mistakenly calling this a “bull market”. It’s just the way this stuff works…
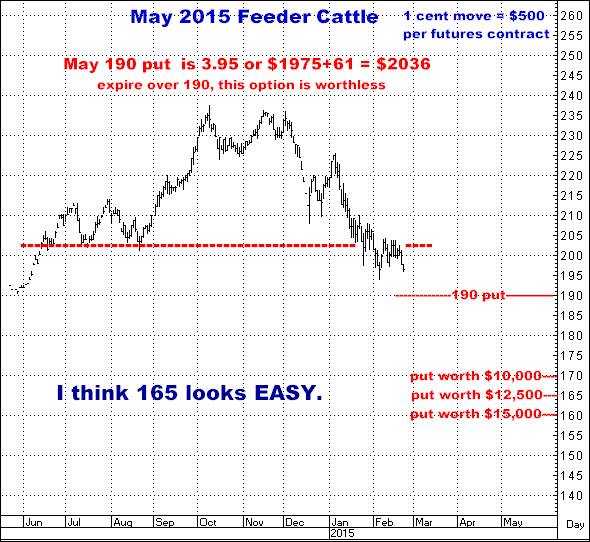
Don’t wait for me to be jumping up and down and screaming, “Look at it go!”. I firmly recommend you go ahead a take the chance now…Really guys. Most of you have seen some version of this before… Like I said, the first thing you are looking for in any trade is, “Which direction is it heading?”. And for my money, IT REALLY DOESN’T GET ANY BETTER THAN THIS. Spend the money. See what happens. Pick up the phone and call me if you have the risk capital…and the mentality…to do this. Thanks, Bill 866-578-1001 770-425-7241 All option prices include all fees and commissions. All price charts generated using Interactive Corp data. |
|