|
Croker-Rhyne Co., Inc. |
|
Main Page |
Philosophy | Current
Recommendations |
Newsletter Archives Contact Us
|
|
|
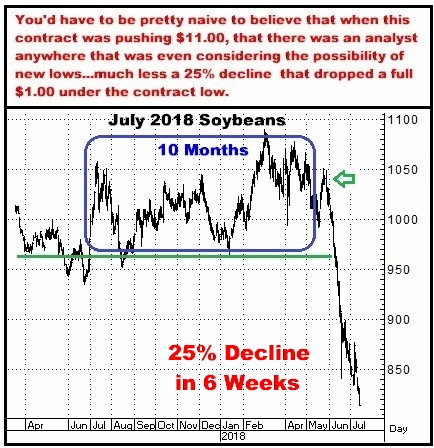
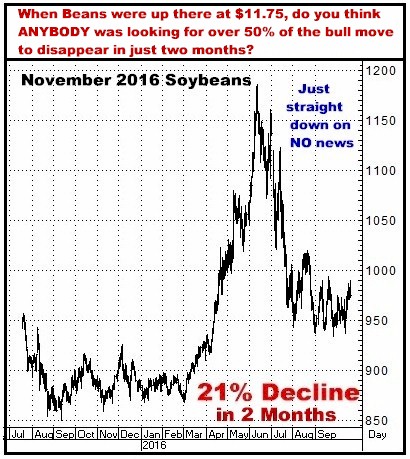
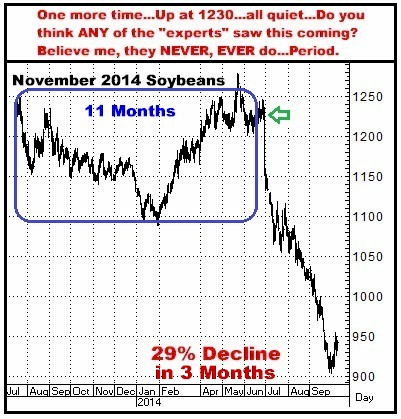
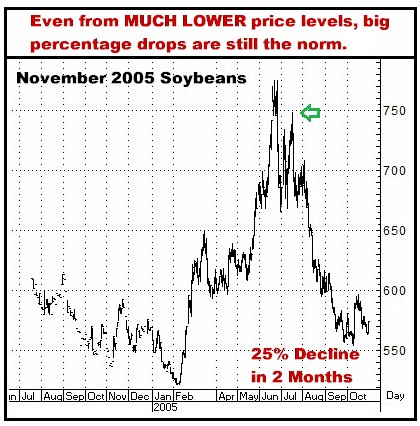
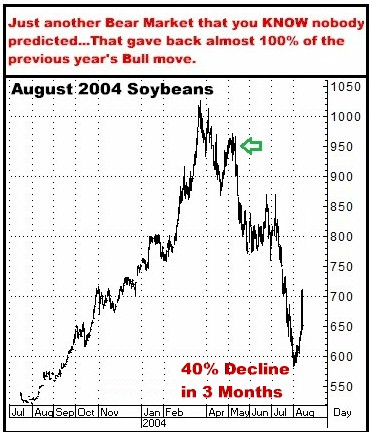
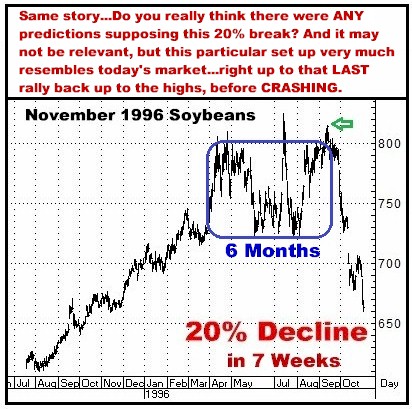
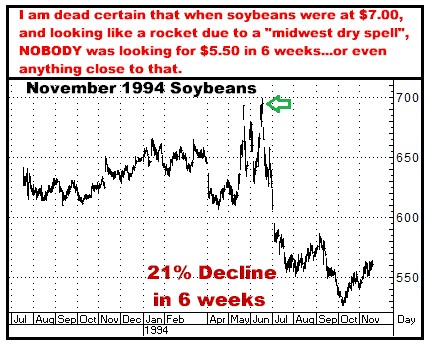
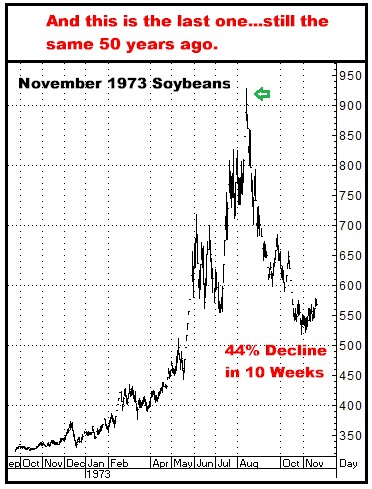
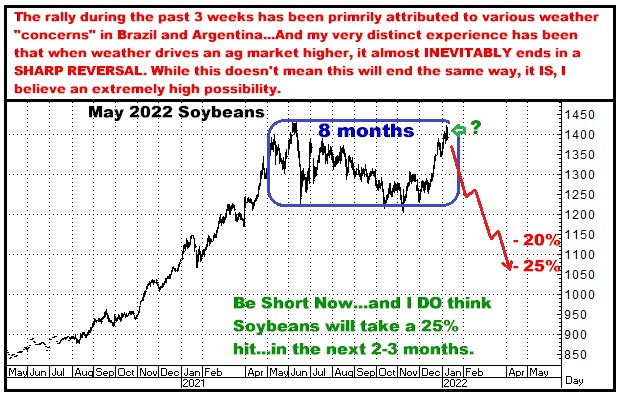
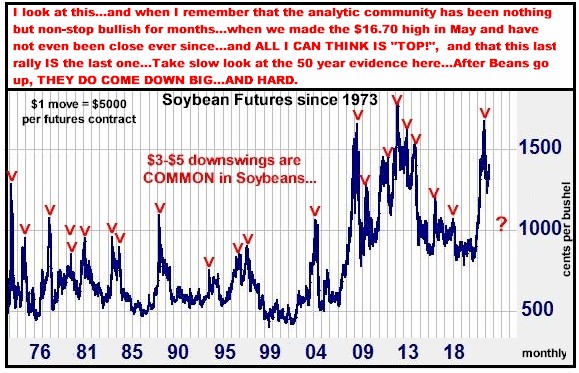
I have long believed that this business is not about 10-20% gains, that what I am personally seeking are trades that can make very LARGE percentage profits…in multiples really…and that generally, when this does happen, my observation has been that the commodity moves that can generate those types of gains often do so within a two to four month window…And getting specifically to it, the Soybean market, that I continue to recommend shorting, frequently presents that opportunity, as, year after year after year, THEY DO MAKE BIG FAST MOVES…In fact, in this respect, my opinion is that there in no other market that can match it. I have been repeatedly calling for a major top and major sell off in the Soybeans (and Soybean Oil) for many months now…and while they made their highs last May, and have had a few downward (and upward) swings, they have essentially been sideways in a $2.00 range ever since…with their most recent upswing, due to “weather concerns” in Brazil and Argentina, taking us to where we are right now…back at contract highs…And I see this rally as the perfect place to be getting short…yes, again… On the charts following, to demonstrate why I am still AGGRESSIVELY shorting this market, I HAVE POSTED EVERY MAJOR TOP IN SOYBEANS FOR THE PAST 50 YEARS…WHERE YOU CAN SEE THAT IN EVERY ONE OF THE 18 TOPS IN SOYBEANS SINCE 1972, THE MARKET DROPPED, MINIMALLY, 20% WITHIN 3 MONTHS OF MAKING THEIR HIGH TICK…WHICH AT TODAY’S LEVELS TRANSLATES INTO A MINIMUM OBJECTIVE OF A $3.00 MOVE, OR $15,000 PER FUTURES CONTRACT… Here is EVERY MAJOR SOYBEAN TOP FOR THE PAST 50 YEARS…My very obvious intent is to show you how big, and fast…and generally beginning “out of nowhere”…they have all been. ALL 18 of them…
Here are all of those collapses summarized…EVERY one of them at least a 20% drop…and EVERY one of them within 3 months of their high.
A few other observations… Sometimes they build lengthy tops…sometimes they have “V” reversals and go STRAIGHT back down… After consolidations, they often have one last “sucker” rally…then reverse down, literally, from one day to the next…with trader’s asking, “Why are they down today?”, which, incidentally, I was hearing TODAY with Soybeans down 27 cents in spite of weather in Brazil and Argentina having been LOUDLY hyped this past weekend. When it starts, you WON’T know you have seen the top tick until it is well on its way to the downside…In other words, do NOT think there’s going to be some obvious magic signal or event that tells you, “Go short now!” THAT’S WHERE OPTIONS ARE A VALUABLE TOOL in that your timing doesn’t have to be perfect. Obviously if I am just damn wrong, not just off in timing, you ARE going to lose money. But do know this…Sooner or later, they ALL got blasted on the downside, and as I noted so many times…virtually no one ever sees it coming. “It’s always the most bullish at the top” IS TRUE. Again, 20% today would mean about a $3.00 move, or $15,000 per futures contract…but the truth is, in today’s hyped up and overly speculative environment, with the trillions of dollars banging in, and out, of the markets, I am looking for something more like 25-30%, which would take Soybeans down about $4.00, to around $10.50 a bushel. And here is the current market…Maybe get a look at it…and then compare it to what you see in the 18 tops…
Obviously, if I am wrong it could mean losing every dollar you invest…But I like these stats…and these odds. On a psychological note: Part of this game is not blinking…
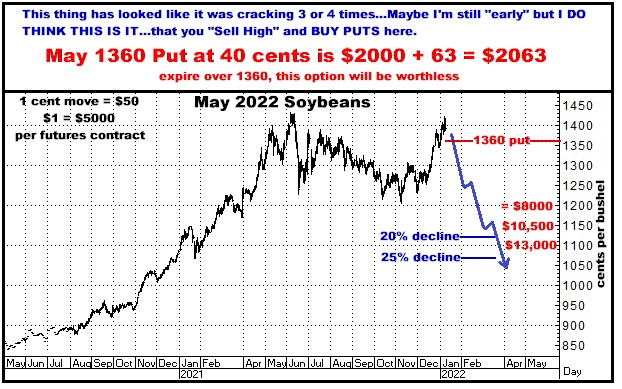
Experience has taught me that one of the amazing aspects about trading is that, over and over (and over), quite often the best time to REALLY make a move is when you have been in a position for a good while, and losing, such that you are so sick of the suffering with idea that you ALMOST become convinced that you are wrong…and should just, “GIVE IT UP, BILL!”…when at the same time, everything that you have learned about how this GAME works tells you that, right now is THE time to STEP UP, not retreat. That, if you can put having been wrong, and losing, out of your head, and imagine that you are now walking up to the table for the very first time, with a fresh wallet, YOU WOULD PROBABLY BE JUMPING ALL OVER THE TRADE. And for me, right here, right now, that IS where I am with Soybeans, that this idea, unlike Eurodollars, has been costing me money for months for months on end…BUT…And as always I MIGHT BE DEAD WRONG…I DO THINK THIS HAS BECOME A TRULY ENORMOUS TRADE. Louder than ever, I will say that I DO think the top IS in, and that any given day…like today…could easily be the start of the collapse. By now, the idea is setting in that the Fed IS finally ready to slam on the brakes…meaning the hammer is coming down. In the end, “You CAN’T fight the Fed,” is totally accurate…and what they want is to absolutely turn the tide on inflation, and WILL…And it would be naïve to not understand that a hefty percentage of the highly elevated prices we now have in commodities are due to nothing more than the Fed having flooded the markets with liquidity, thereby leading to massive fund bullish speculation (in everything really)…For sure, weather and supply-demand equations can push row crop prices higher, but without the fund money that we have sloshing in (and out) of the markets, I think there is no way we would see row crop prices where they are…and have been…today. And when the rug comes out, bull markets DO collapse just like they have for decades…and just like they have done at EVERY Soybean top, as seen above, for the past 50 years. To me, the question is not “if,” but “when.” And again, there WON’T be some magic signal telling you to go short…So it’s a guess for sure but also just a question of picking the spot and then owning the time…And the truth is, getting in is not the hard part…The hard part comes when the market is really working for you, and being able to just sit tight (as we have been doing with Eurodollars). Unless 50 years of history is worthless, this IS going to happen…and for me, it’s just a matter of the math…As in what is the cost of my options and what can they become when the 20% downturn does take place? Here’s an option I like right here…
Here’s the long term picture…
Mathematically, at these levels, there is an argument that says you get short…and stay short…that when this pays, it will pay in multiples…And yes, if it does NOT ever go down, you could lose whatever you have invested…But one more time, I will take these odds. I have stayed with this, through months of PAINFUL sideways, because I KNOW what can happen dollarwise when it does do what it has done…as noted…following EVERY bull market for the past 50 years. Call me if you think this makes sense, have the risk capital…and think the risk is worth the potential reward. Thanks, Bill 770-425-7241 866-578-1001 All option prices in this newsletter include all fees and commissions. All charts, unless otherwise noted, are by Aspen Graphics and CRB. The author of this piece currently trades for his own account and has a financial interest in the following derivative products mentioned within: Soybeans
|
|