|

February 3, 2025
They ARE reversing…
Now 10 cents off their Feeder Highs
Now 8 cents off Live Cattle High
As
I noted last week: When, as it has been for the past 8-10 days in Cattle, ALL
of the news is about the HOT cash market, you’d better lookout. For sure, when
the cash is popping, it makes EVERYBODY in the industry feel good…and blindly
(foolishly) optimistic about the future…but again, and I’ll put it bluntly, THE
CASH MARKET DOES NOT HAVE A GD THING TO DO WITH THE FUTURE…THAT, IF ANYTHING,
ALL IT DOES IT CREATE TRAPS FOR GIDDY BULLS…and more specifically, when the
CASH MARKET DOES BECOME 100% OF THE STORY, IN MY EXPERIENCE IT ALMOST ALWAYS
MEANS, “SELL NOW!”
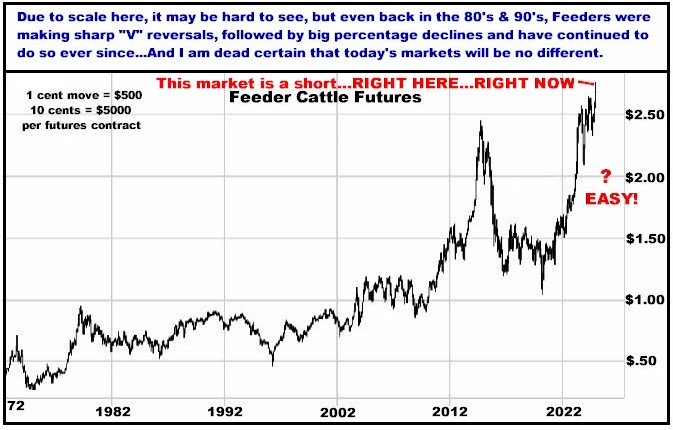
As I have documented many times here, the cattle
market has a 50 year record of making SHARP bullish to bearish turns…and then
almost immediately going relatively straight down…to the extent that if
you DO want to get short, when they present evidence of a reversal, you CANNOT
wait around for a convenient “bounce” to get on . In
other words, you either need to already be there when they turn, or if you’re
not, at the FIRST potential sign of a reversal, YOU GET SHORT POSITIONS
ESTABLISHED.
In
the midst of rip roaring cash news the past two
weeks…AND a purportedly bullish Cattle on Feed Report a week ago…AND a further
bullish Cattle Inventory Report this past Friday (“Smallest Herd since 1952!”),
BOTH LIVE CATTLE AND FEEDER CATTLE CLOSED FRIDAY WITH DOWNSIDE WEEKLY REVERSALS…FOLLOWED
BY SHARPLY LOWER TRADE IN BOTH TODAY.
Is this finally it? I don’t know but I DO know that THE FUTURES MARKET MORE OR LESS IGNORING TWO
CONSECUTIVE BULLISH REPORTS…AND ROARING CASH…CERTAINLY MUST REPRESENT SOME KIND
OF A SIGNAL AS TO WHERE THIS MARKET IS HEADED…
I’M SCREAMING IT. GET SHORT
CATTLE NOW.
Their NORM (see 50 year tables
below) IS to drop between 15%-25%...And
some years have multiple sizeable declines…
Feeder Cattle Declines since
1974
|
Year
|
Size of Decline |
Timeframe |
|
1974 |
36% |
2
months |
|
1974 |
30% |
2
months |
|
1975 |
22% |
6
weeks |
|
1976 |
19% |
10
weeks |
|
1976 |
21% |
5
weeks |
|
1977 |
16% |
7
weeks |
|
1978 |
17% |
1
month |
|
1979 |
20% |
7
weeks |
|
1980 |
24% |
6
weeks |
|
1981 |
21% |
5
months |
|
1981 |
16% |
3
months |
|
1982 |
17% |
7
weeks |
|
1985 |
14% |
11
weeks |
|
1985 |
16% |
2
months |
|
1986 |
20% |
3
months |
|
1996 |
19% |
6
weeks |
|
1998 |
16% |
3
months |
|
2002 |
15% |
10
weeks |
|
2004 |
25% |
1
month |
|
2006 |
18% |
9
weeks |
|
2008 |
17% |
4
months |
|
2008 |
15% |
9
weeks |
|
2012
|
17% |
6
weeks |
|
2013 |
17% |
4
months |
|
2015 |
17% |
9
weeks |
|
2015 |
20% |
3
months |
|
2016 |
22% |
3
months |
|
2018 |
15% |
5
weeks |
|
2019 |
17% |
5
weeks |
|
2020 |
24% |
6
weeks |
|
2024 |
21% |
7
weeks |
|
Avg |
18.8% |
8.5
Weeks |
A 20% decline in Feeders from current levels equates to
about 55 cents or $27,500 per futures contract…
Price Declines in Live
Cattle
Prices since 1978
|
Year |
% Decline |
Time Frame |
|
1978 |
16% |
2 mos. |
|
1979 |
26% |
5 mos. |
|
1980 |
12% |
2 mos. |
|
1980 |
20% |
6 mos. |
|
1981 |
18% |
5 mos. |
|
1982 |
26% |
6 mos. |
|
1983 |
16% |
7 mos. |
|
1984 |
14% |
7 mos. |
|
1985 |
25% |
8 mos. |
|
1986 |
18% |
3 mos. |
|
1987 |
9% |
3 mos. |
|
1988 |
16% |
2 mos. |
|
1989 |
12% |
4 mos. |
|
1991 |
22% |
5 mos. |
|
1993 |
18% |
7 mos. |
|
1994 |
22% |
3 mos. |
|
1995 |
20% |
7 mos. |
|
1996 |
21% |
4 mos. |
|
1996 |
14% |
5 mos. |
|
1997 |
16% |
5 mos. |
|
1998 |
16% |
5 mos. |
|
2000 |
13% |
4 mos. |
|
2001 |
26% |
9 mos. |
|
2002 |
19% |
4 mos. |
|
2003 |
33% |
3 mos. |
|
2005 |
17% |
3 mos. |
|
2006 |
19% |
4 mos. |
|
2007 |
17% |
3 mos. |
|
2008 |
18% |
4 mos. |
|
2011 |
22% |
2 mos. |
|
2012 |
13% |
5 mos. |
|
2015 |
29% |
7 mos. |
|
2016 |
30% |
8 mos. |
|
2017 |
28% |
5 mos. |
|
2018 |
16% |
2 mos. |
|
2019 |
24% |
5 mos. |
|
2020 |
23% |
2 mos. |
|
AVG. |
19.5% |
4.6 mos. |
A 20% decline
in Live Cattle from current levels equates to about 40 cents or $16,000 per
futures contract.
Considering the truly stratospheric levels
we’re at, I see ZERO reason to expect anything less than the 50 year average
drops of both markets.
If you think my case makes sense, and have
the stomach for this sort of investment…and the risk capital…I URGE YOU TO
CONTACT ME AND DO SOMETHING WITH IT…N-0-W.
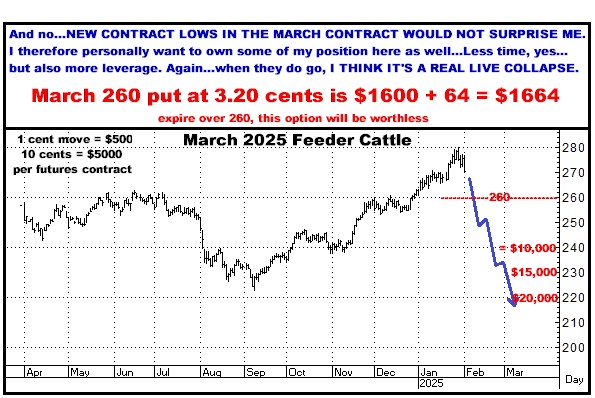
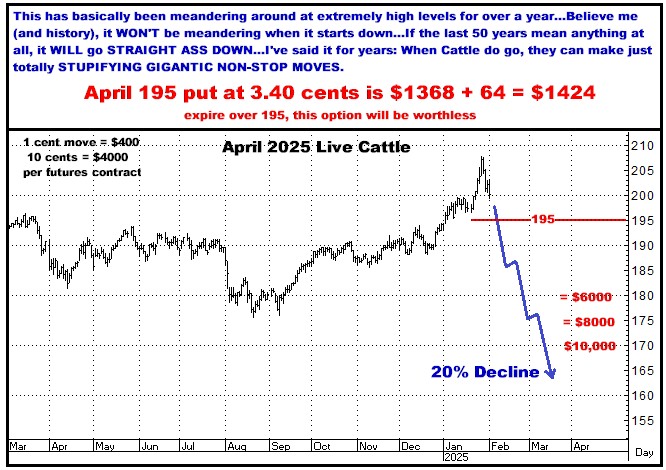
Options
I like here (which may be more expensive tomorrow)
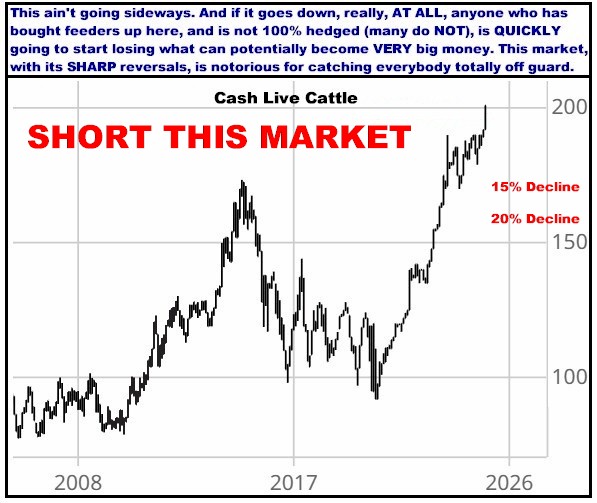
What I've drawn below is not wishful
thinking. Per the histories I've shown you so many times, Feeders do frequently
make their turn and DO go straight down...And DO know that AS Live Cattle
prices weaken, AT ALL, from current levels, EVERY Feeder Cattle owner from up
here will immediately start losing money...which can quickly turn into BIG
money…and NEW FEEDER BUYERS WILL LIKELY THEN BEGIN TO TOTALLY DISAPPEAR...and
believe me, DISAPPEARING BUYERS MEANS CRASHING PRICES.

Been waiting, and waiting, and waiting…But
more so than ever, this looks and feels like it’s here.
It’s big. Maybe I’m dead wrong, which can mean
losing every dollar you spend, but I SEE big MONEY HERE.
Do it. Do SOMETHING while it’s up here…NOT after it’s dropped 8-10% and I’m
breathing fire about getting more…Call me now and get on.
It’s in your court guys. Wish I could…but I
can’t do it for you…
Thanks,
Bill
770-425-7241
866-578-1001
All
option prices in this newsletter include all fees and commissions. All charts,
unless otherwise noted, are by Aspen Graphics and CRB.
FUTURES
TRADING IS NOT FOR EVERYONE. THE RISK OF LOSS IN TRADING CAN BE SUBSTANTIAL.
THEREFORE, CAREFULLY CONSIDER WHETHER SUCH TRADING IS SUITABLE FOR YOU IN LIGHT
OF YOUR FINANCIAL CONDITION. PAST PERFORMANCE IS NOT INDICATIVE OF FUTURE
RESULTS. THERE IS NO GUARANTEE YOUR TRADING EXPERIENCE WILL BE SIMILAR TO PAST
PERFORMANCE.
The author of this piece currently trades for his own
account and has a financial interest in the following derivative products
mentioned within: Feeder Cattle, Live Cattle